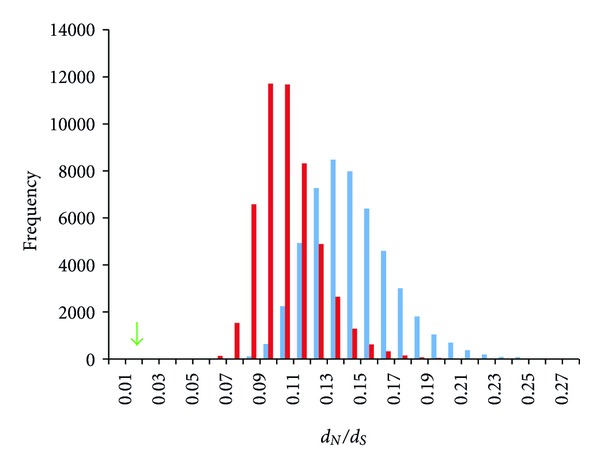
Figure 4.

Frequency distribution of average d N/d S values from 50,000 randomization sets comprising 16 node groupings from 5,666 1 : 1 orthologs between C. elegans and P. pacificus (blue bars). Red bars indicate frequency distribution of average d N/d S values from 50,000 randomization sets of 16 node groupings that include 6 Gα subunit proteins in each; this control group was examined to investigate potential bias in our network by having 6 Gα subunit proteins within our odor genetic network. The x-axis represents binned divergence categories plotted against the frequency on the y-axis. The green arrow indicates the actual average d N/d S value of the nematode odor network.
