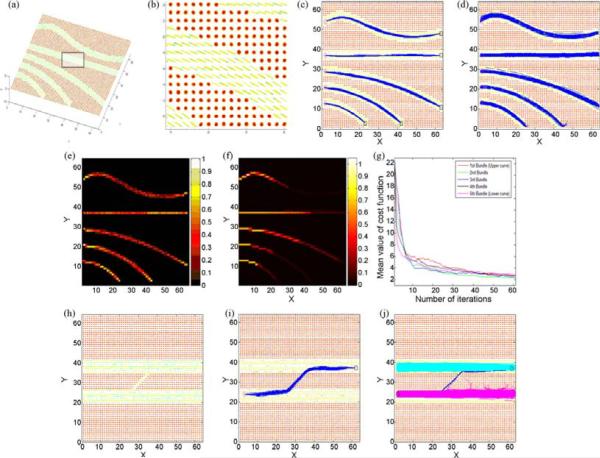
Fig. 1.
Fibers tracking with synthetic tensor data. (a) A 3D view of one slice of the synthetic dataset. (b) Enlarged 2D view of the boxed region in (a). (c) Results from the GeneTrack algorithm. (d) Results from the Friman method. (e) Density map of connection probability from GeneTrack algorithm. (f) Density map of connection probability from Friman method. (g) Variations of the mean value of cost function with the number of iterations. (h) A synthetic dataset for comparing the tracking efficiency between the GeneTrack and Friman method. (i) Fiber tracts resulting from the GeneTrack. (j) Fiber tracts resulting from the Friman method. Magenta denotes fibers tracked from the ROI at the left; cyan denotes fibers tracked from the ROI at the right; fibers connected to both ROIs are denoted in red or blue.

