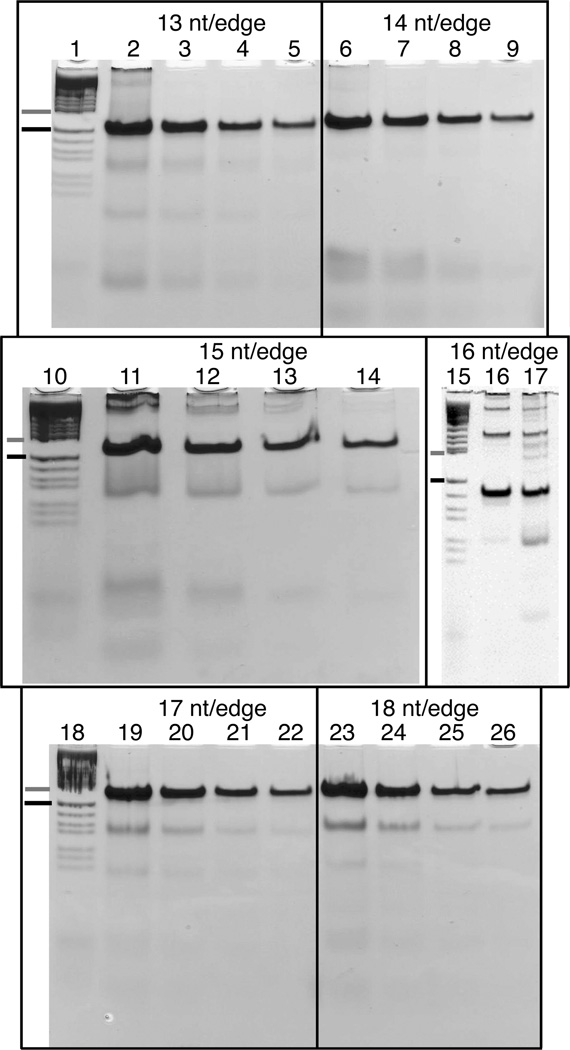
Figure 6. Tensegrity Triangle Gels.
Tensegrity triangles were constructed with edge lengths 13 through 18 nucleotides. Room temperature non-denaturing polyacrylamide gels show the triangles annealed at different concentrations. For each gel, the first lane contains markers consisting of a pBR322 HaeIII digest, with a gray dash marking the 184 base pair band, and a black dash marking the 124 base pair band. The three larger gels contain 10% polyacrylamide, and the tensegrity triangle concentrations are 12µM, 6µM, 3µM, and 1.5µM in order left to right. The small gel contains 8% polyacrylamide. Lane 17 was run at a strand concentration of 4µM. Lane 16 shows material that was taken from an earlier gel run where the monomer target band was cut out, eluted, and reannealed to a concentration of 4µM. The tendency of the systems to form multimers is proportional to the strain calculated in the text. The least multimer-prone structures are tensegrity triangles with 14 nucleotide pairs on an edge (left-handed), and 17 or 18 nucleotide pairs on an edge (right-handed).

