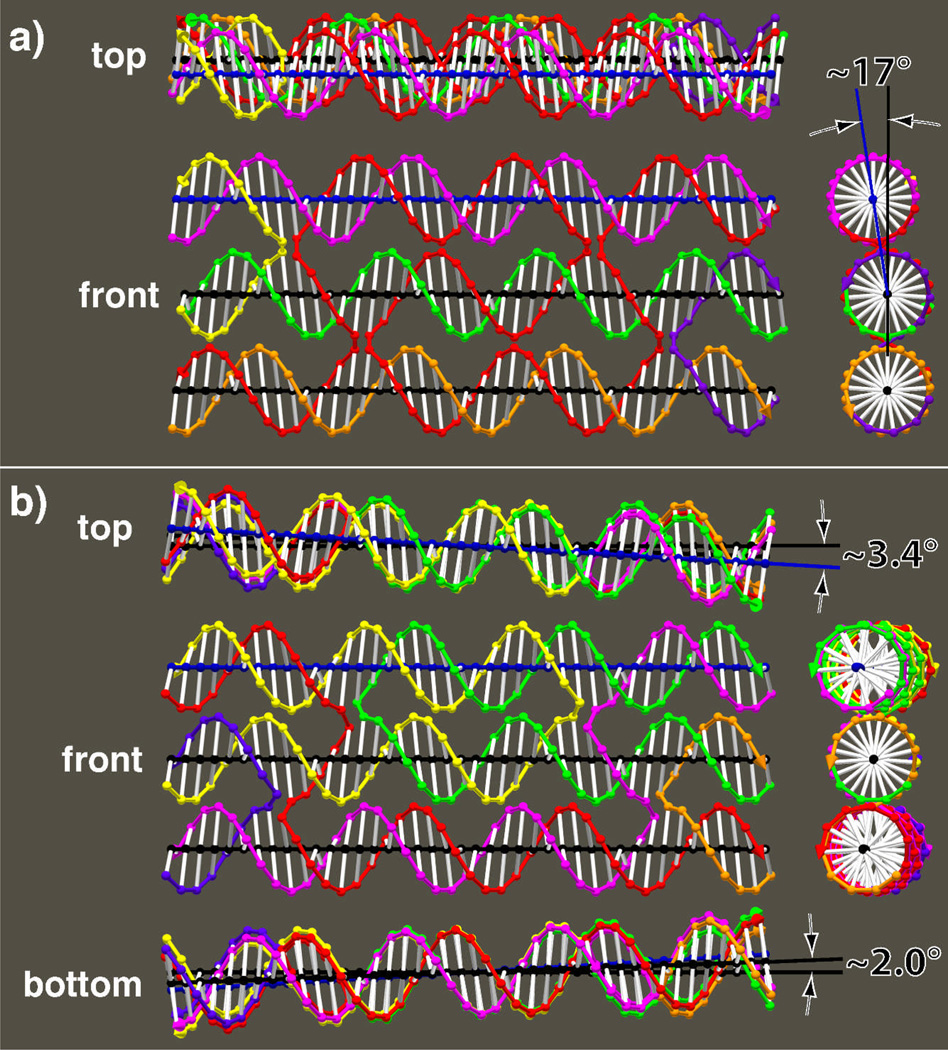
Figure 8. Base Tilt Models of TX molecules.
TX molecules were modeled using the same strategies as in Figure 7. (a) A TX molecule with an even number of half turns between junctions.32 The domains are parallel, but the upper domain is ~17° out of the plane defined by bottom two. (b) A TX molecule with an odd number of half turns between junctions.17 The top domain is turned about 3.4° relative to the middle domain, and the bottom domain is turned about 2.0° relative to the middle domain, with top and bottom domains turned in the same direction.

