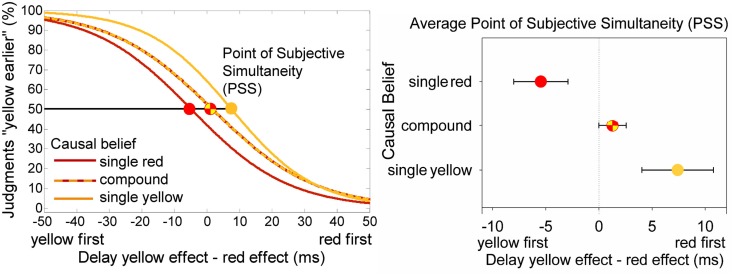
Figure 3.
Results of prototypical participants (left) and group means for the PSS (right). On the left fitted functions of three prototypical participants from the single effect yellow and red group (colors according to group name) and the compound effect group (dashed line). The group means of the points of subjective simultaneity are shown in the bar chart on the right. Error bars depict standard errors.

