
Figure 3.
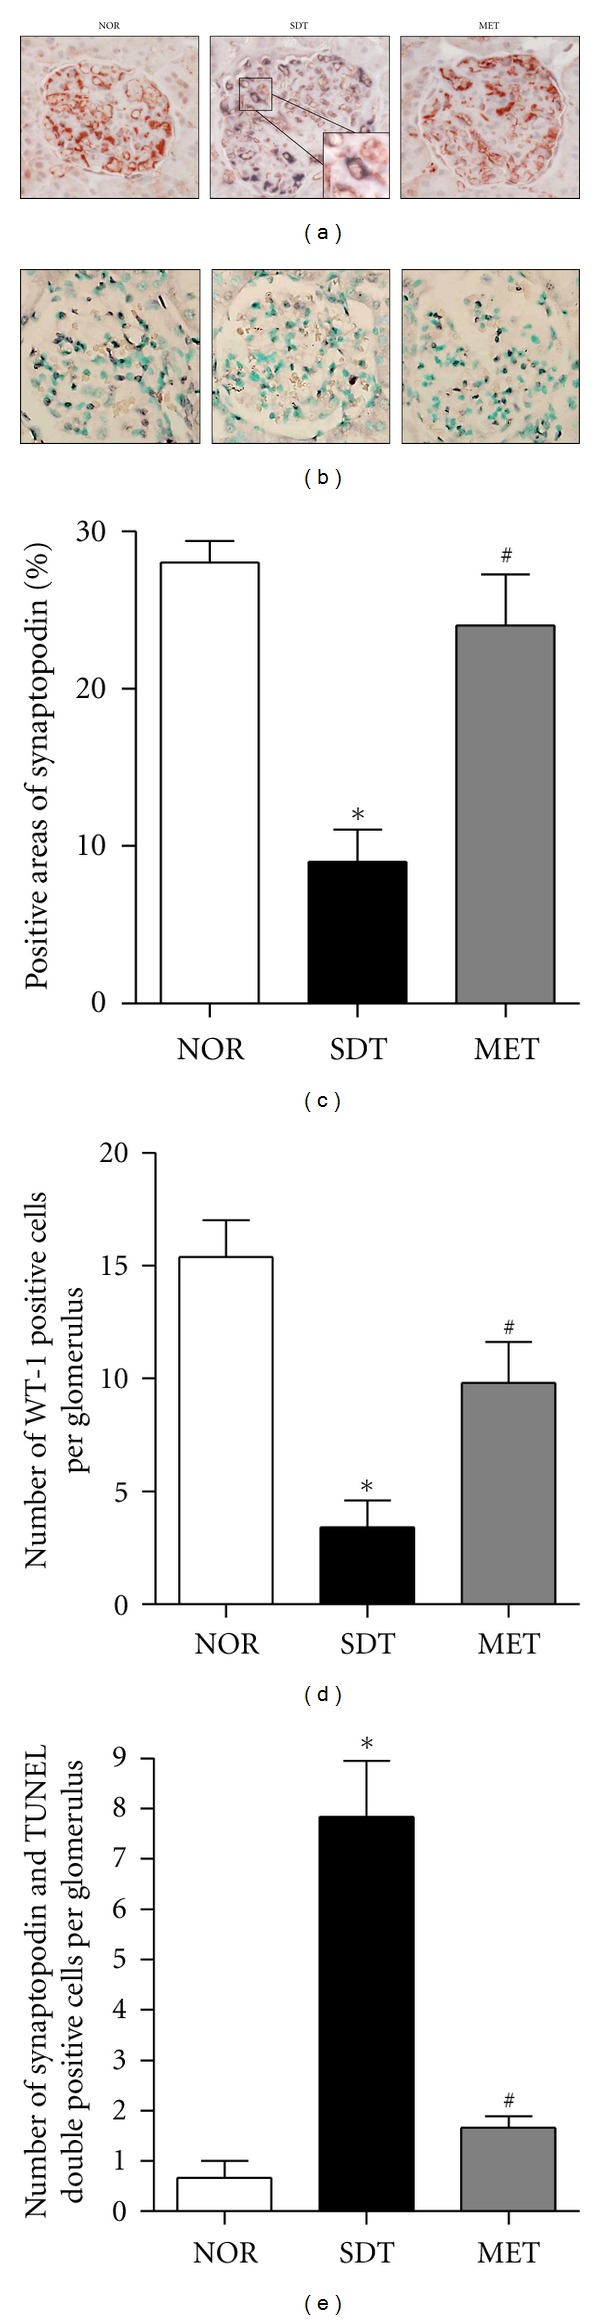
Podocyte loss. A representative photomicrograph of (a) dual labelling for TUNEL (black) and synaptopodin (red) and (b) WT-1 (black). ×400 magnification. Double-positive cells (magnified inset) indicates the colocalization of the podocyte marker and apoptosis. Quantitative analyses of (c) positive areas of synaptopodin, (d) positive cells of WT-1 and (e) TUNEL and synaptopodin-double-positive cells. All data are expressed as mean ± SE (n = 8). *P < 0.01 versus NOR group, # P < 0.01, versus SDT group.