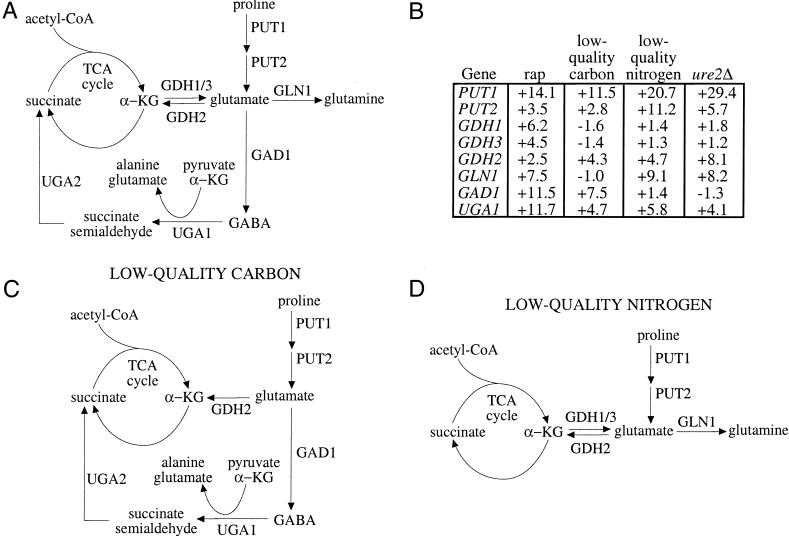
Figure 4.
A diagram for the flux of metabolites around the TCA cycle under different nutrient conditions. (A) Shown is a partial map of the TCA cycle, with intermediates succinate and α-ketoglutarate (α-KG). Reactions that produce metabolites that can flow into the TCA cycle or glutamine synthesis are shown. (B) Some of the genes depicted in A are listed in a table along with their induction values after treatment with 50 nM rapamycin for 30 min, low-quality carbon (ethanol) for 30 min, low-quality nitrogen (proline) for 30 min, or in a ure2Δ strain compared with wild type in steady state. Data are taken from publicly available, downloadable whole-genome transcription profiling experiments (3). (C) Based on the gene inductions from B, a flow of metabolites is depicted where positive gene inductions are interpreted as increased flow through the reaction catalyzed by that gene. Shown is the proposed flow of metabolites when cells are shifted from glucose to ethanol, a high- to low-quality carbon source shift, using data from B. (D) Shown is the proposed flow of metabolites when cells are shifted from glutamine to proline, a high- to low-quality nitrogen source shift, using data from B. GABA, γ-aminobutyric acid.

