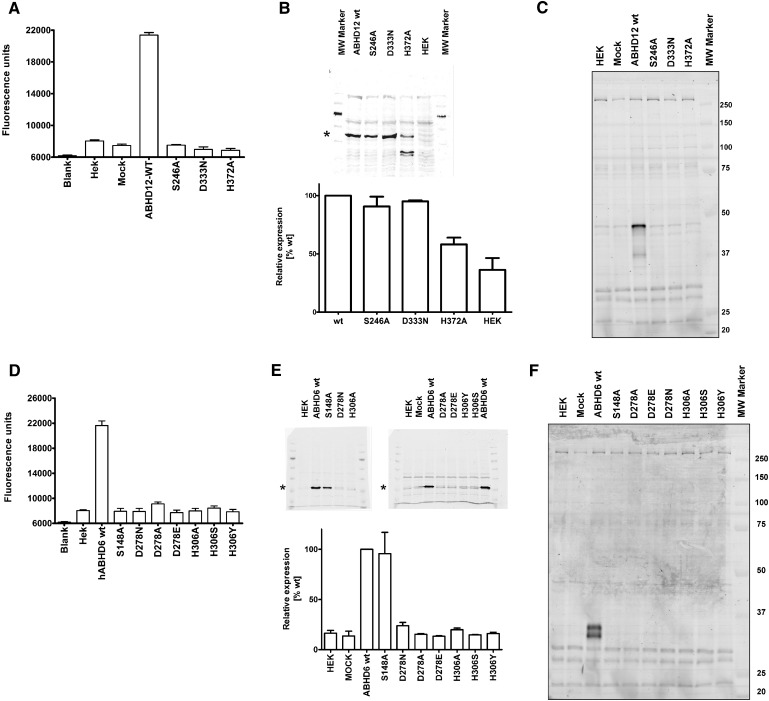
Fig. 3.
Analysis of hABHD6 and hABHD12 active site mutants. a: Raw fluorescence data of the hABHD12 SDH-mutants, analyzed using 2.8 µg cellular lysate per well. b: Western blots of the hABHD12 SDH-mutants (top) and the relative expression level of the mutants as compared with the wild-type enzyme (bottom), based on quantification of the protein bands indicated with an asterisk. The quantitative data are mean ± SEM from three separate transfections and were normalized against β-tubulin. c: TAMRA-FP labeling of the hABHD12 SDH-mutants. Molecular weight markers (kDa) are shown in the column at right. Data are from one set of transient transfections; transfections were repeated independently three times with identical outcome. d: Raw fluorescence data of the hABHD6 SDH-mutants analyzed using 2.8 µg cellular lysate per well. e: Western blots of the hABHD6 SDHmutants (top) and the relative expression level of the mutants as compared with the WT enzyme (bottom) based on quantification of the protein bands indicated with an asterisk. The quantitative data are mean ± SEM from three (WT, S148A, D278N, H306A) or two (all others) separate transfections and were normalized against β-actin. f: TAMRA-FP labeling of the hABHD6 SDH mutants. Molecular weight markers (kDa) are shown in the column at right. Data are from two sets of transient transfections; transfections were repeated independently three times (WT, S148A, D278N, H306A) or twice (all others) with identical outcome.

