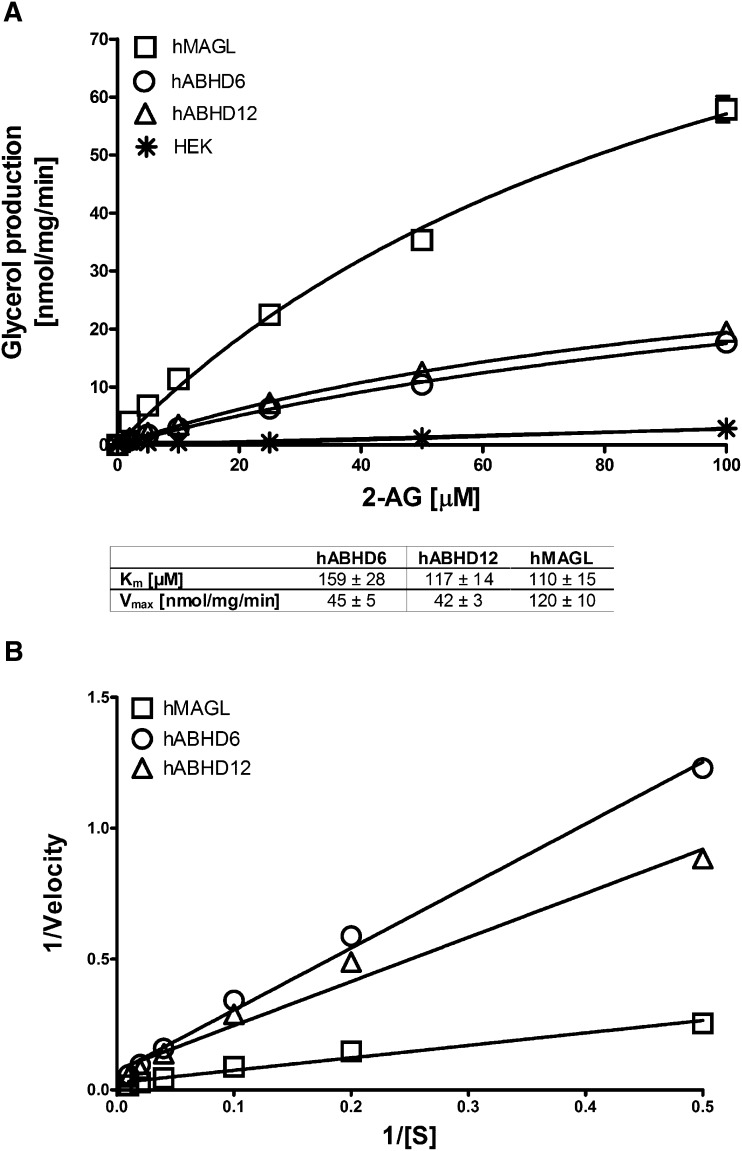
Fig. 4.
Km and Vmax values for 2-AG. a: HEK293 cells were transiently transfected with the cDNAs encoding hMAGL, hABHD6, or hABHD12 as detailed in Materials and Methods. After 48 h, cells were harvested, and lysates were prepared for hydrolase activity measurements as described in Fig. 1. Cellular lysates (0.3 µg/well) were incubated with the indicated concentrations of 2-AG, and the Km and Vmax values were determined at 60 min; substrate consumption was <10%. The Km and Vmax values are shown in the box and were calculated as nonlinear regressions using GraphPad Prism 5.0 for Windows. b: The Lineweaver-Burk plots of the data. Values are mean ± SEM from three independent experiments.

