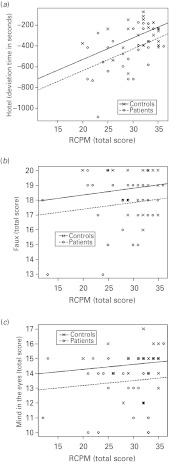
Fig. 2.
Scatterplots relating performance in (a) Hotel, (b) Faux Pas and (c) Mind in the Eyes to Raven's Colored Progressive Matrices (RCPM) for patients with Parkinson's disease (PD) (circles) and controls (crosses). Regression lines (broken for PD and solid for controls) reflect the average within-group association of the two variables, as determined by ANCOVA, constrained to have the same slope across groups.

