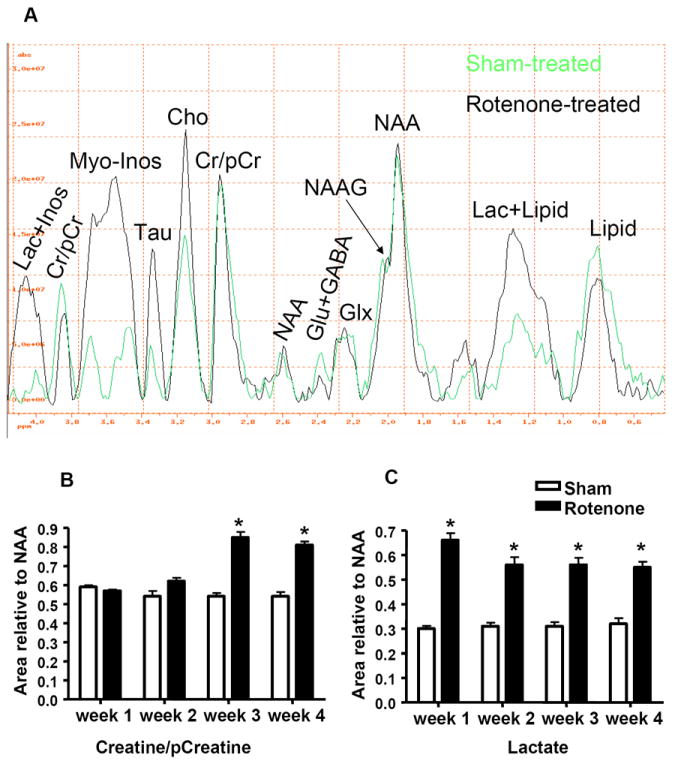
Figure 3.

(A). In vivo 1H MRS spectra obtained from the striatum of rotenone- and sham-treated mice after 4-weeks of rotenone treatment. (B). Histograms represent the value of the area under the peak relative to NAA of Cr/pCr and (C). Lactate. NAA: N-Acetyl-Aspartate, Glu: Glutamate, GABA: Gamma-Aminobutyric Acid, Glx: glutamate and glutamine, Lac: Lactate, Cr: Creatine, pCr: phosphor-creatine, Inos: Inositol, Tau: Taurine, Cho: Choline. * indicates significantly different to control, n=4, Mann Whitney U, P<0.05, mean ±SD.
