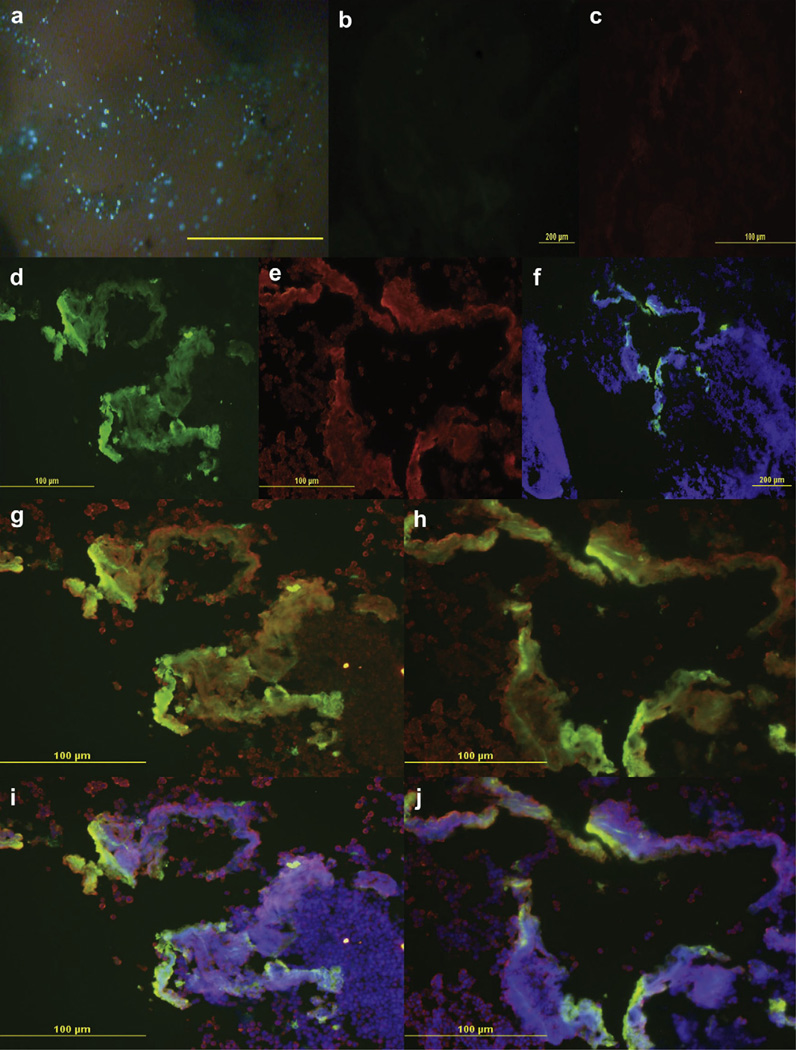
Fig. 4.
GFP expression analysis in 3D tumor model. Efficiency of pEGFP-N1 delivery was analyzed by fluorescence imaging and showed increased GFP distribution when delivered with the 6PE using LVLP parameters after 24 h (a–j). (a) Stereomicroscope image of a 0.8–1.0 cm HaCaT spheroid + B16.F10. Melanoma cells were indicated by dark brown spots, HaCaT cells were indicated by a tan color and successfully transfected cells produced green fluorescence. Mag 96×. (b) Negative control FITC channel tested non-specific secondary binding in the absence of primary antibody. (c) Negative control in the TRITC channel. (d) GFP expression alone in the FITC channel. (e) Cytokeratin AE1/3 rhodamine antibody specifically labeled HaCaT, visualized in the TRITC channel. (f) Merged image of DAPI blue and GFP green channels. (g–h) Merged image GFP green, DAPI blue, and Cytokeratin red channels; overlay of images produced a yellow or orange fluorecence, HaCaT cells lacking GFP expression appeared red and GFP expressing B16.F10 cells appeared green. (i–j) Overlay of red HaCaT and green GFP produced a orange fluorescence signifying that HaCaT were labeled, while yellow or green specified B16.F10 cells expressing GFP. An Olympus BX51 microscope with camera was used to take pictures at Mag 100× (f) and 200× (b–e,g–j). Sections were cut 8–10 µm thick; images are a representation 8–10 experiments performed. Scale bars, 2 mm(a); 200 µm (b,f); 100 µm (c–e, g–j). (For interpretation of the references to colour in this figure legend, the reader is referred to the web version of this article.)

