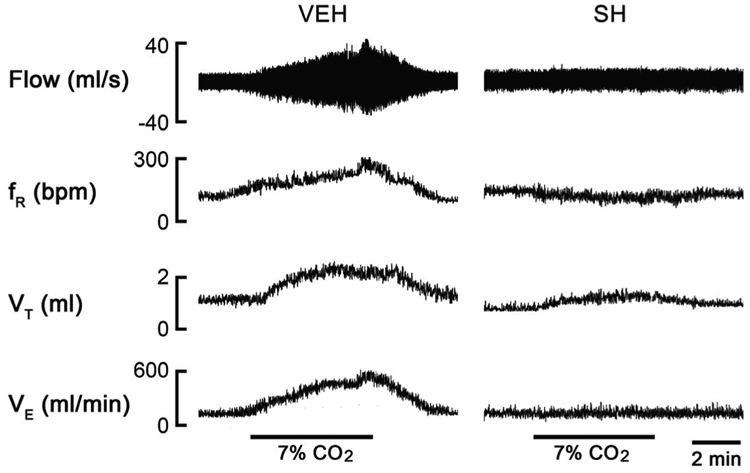
Figure 3.
Examples of experimental recordings showing the hypercapnic ventilatory responses in a vehicle (VEH)- and a high-dose of sarin (SH)-exposed rats 2 h after exposure by plethysmorgraphy. The traces from the top to bottom are airflow (Flow), respiratory frequency (fR), tidal volume (VT), and minute ventilation (VE). SH almost eliminated the VE response to hypercapnia.

