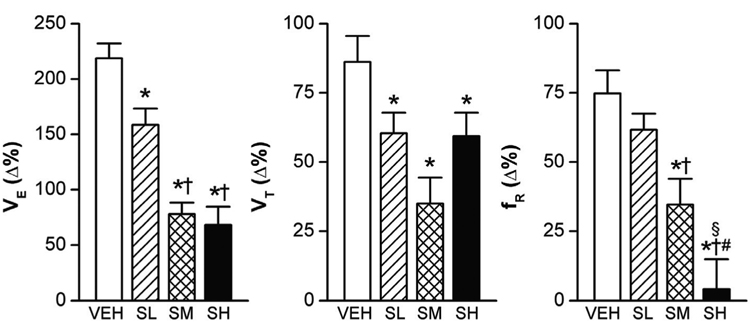
Figure 4.
The hypercapnic ventilatory (VE) responses (7% CO2 for 5 min) in rats exposed to three different levels of sarin. As compared with vehicle only (VEH), high and moderate sarin exposure (SM and SH) decreased the VE responses more than the low level of sarin (SL). The respiratory frequency (fR) response was absent in SH-exposed rats. Mean ± SE; n = 12, 12, 8, and 8 for VEH, SL, SM, and SH animals, respectively. * P < 0.05, compared with VEH group; † P < 0.05, SM and SH vs. SL; # P < 0.05, SH vs. SM group; § P > 0.10, compared with baseline “0”.

