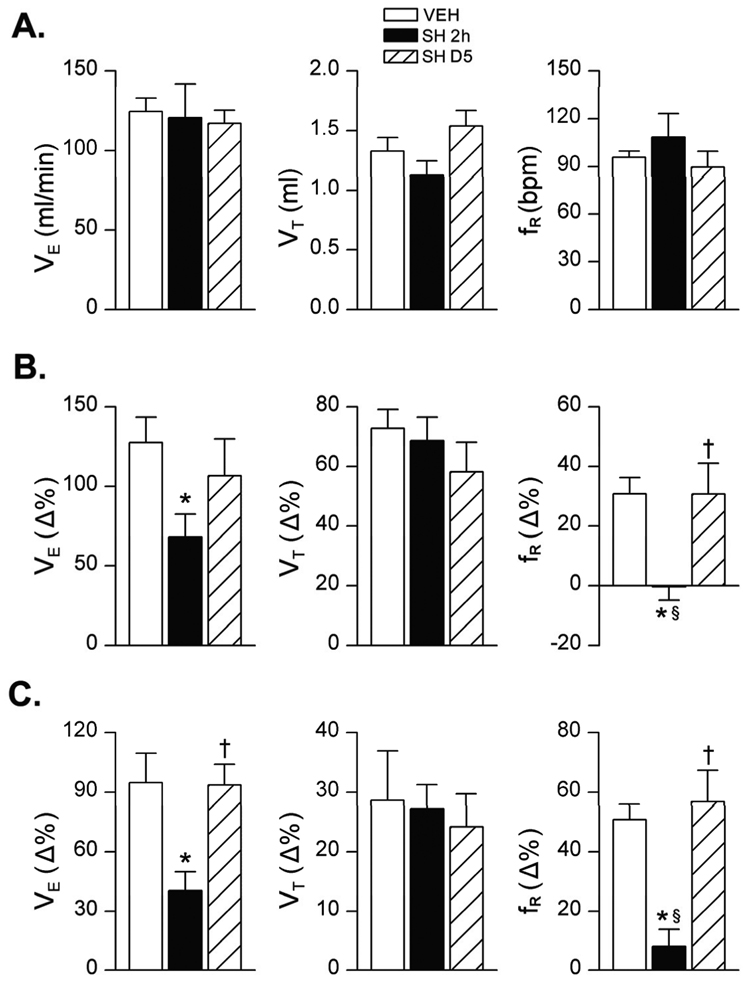
Figure 6.
Group data of the baseline VE (panel A) and hypoxic VE responses to hypercapnia (7% CO2 for 2 min, panel B) and hypoxia (10% O2 for 1 min, panel C) in the anesthetized rats exposed to vehicle only (VEH) or high-dose sarin (SH), respectively. Mean ± SE; n = 12, 6, and 6 for VEH, 2 h after SH (SH 2h), and 5 days after SH (SH D5) groups, respectively. * P < 0.05, compared with VEH group; † P < 0.05, SH D5 vs. SH 2h groups; § P > 0.10, compared with baseline “0”.

