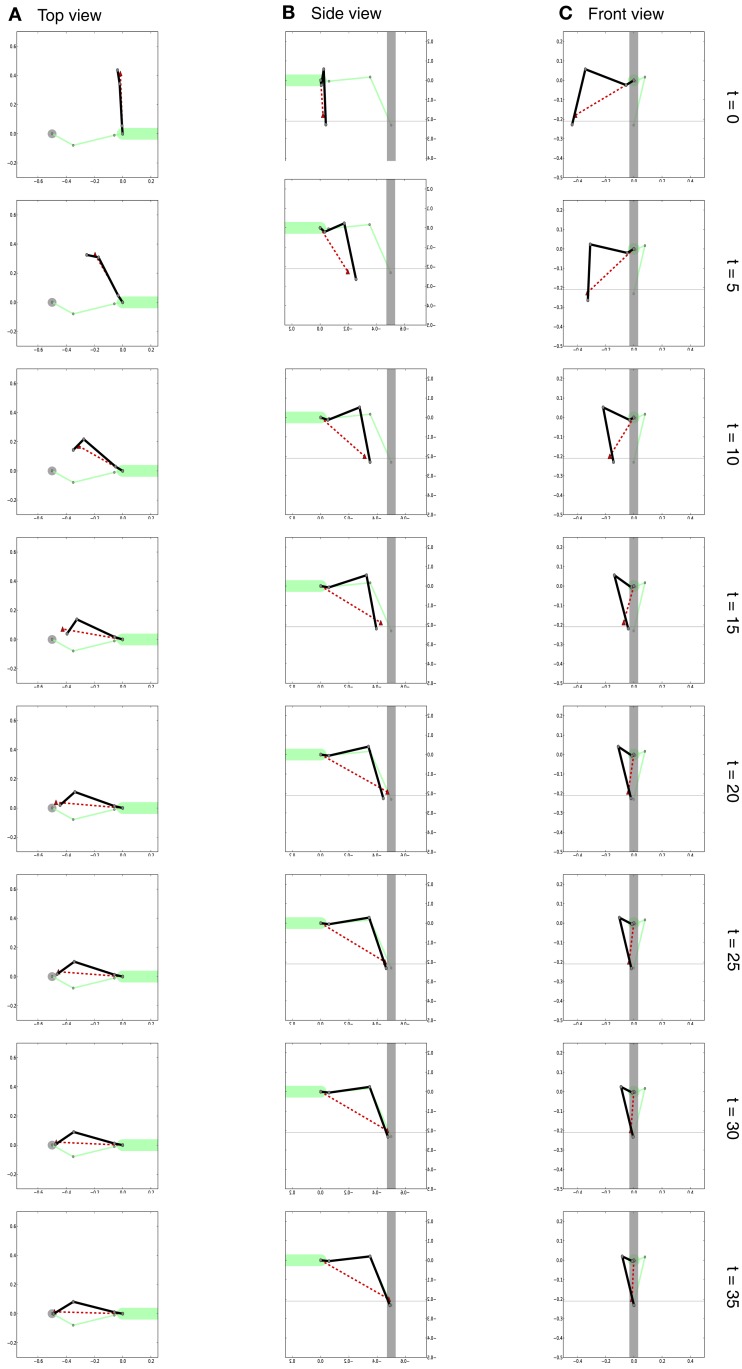
Figure 9.
Different views of the movement of the right front leg (dark solid lines) during the targeted movement toward the front. [Views as shown in Figure 6. Note that as we are looking at the right leg in (B) we are looking from the other (the right) side.] Shown is the movement over time. The configuration of the left leg is shown as a solid light green line. The red dashed line shows the target position provided by the body model as a target vector for the leg network of the right front leg. View from above is shown in (A), side view is shown in (B) and view from the front is shown in (C). Right: number of iterations.

