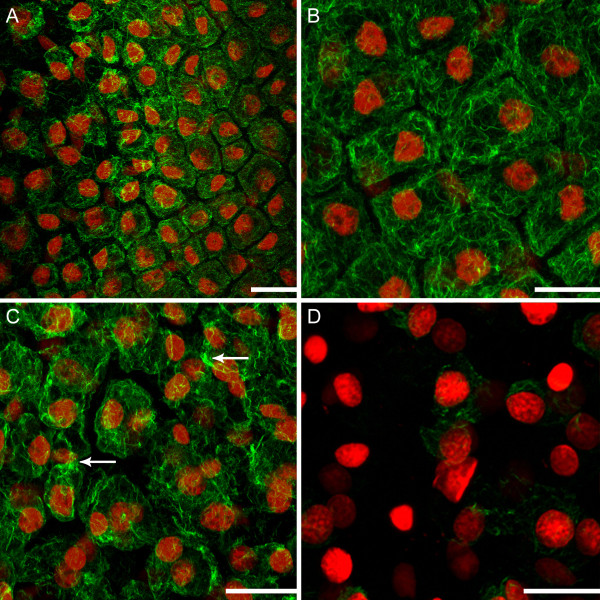
Figure 2.
Alterations in cytoskeletal dynamics within a single areole of a window stage leaf. Each image represents a maximum projection of approximately 50 z-stack images. (A) Half of a single areole of a window stage leaf, displaying the gradient of non-PCD (NPCD), early-PCD (EPCD) and late-PCD (LPCD). Actin microfilaments are stained green with Alexa Fluor 488 Phalloidin, while nuclei are stained red with propidium iodide. Note the variation in cytoskeletal dynamics across this gradient. (B) NPCD cells displaying a thin layer of actin microfilaments underlying the PM. (C) EPCD cells displaying actin microfilament bundling. Note the bundles of actin found in several cells within the field of view (arrow). (D) LPCD cells displaying actin microfilament breakdown. Note the loss of actin staining within these cells and the discontinuous nature of the filaments that are still present. Scale bars: A-D = 100 μm.

