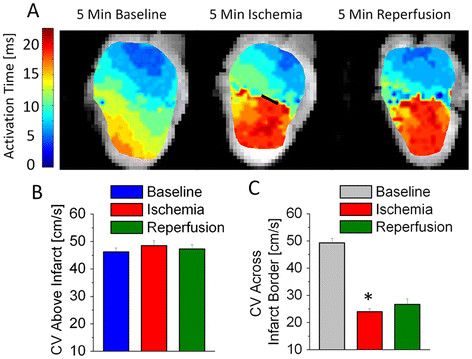
Figure 5.
Conduction velocity on the ventricular surface slows dramatically across the infarction border and does not recover. Recordings of Ca2+ fluorescence were analyzed offline to determine the CV of the activation wavefront on the ventricular surface. (A) Plotting a map of activation times along the surface of the heart indicates that tissue in the MI region activates much later than normal during both ischemia and reperfusion. The black line in the ischemia map indicates the region of suture constriction ( B) CV in the region above the suture is unchanged throughout the protocol. ( C) The CV across the border drops significantly by 5 minutes of ischemia and doesn’t recover during reperfusion (also shown at 5 minutes), reflecting the changes in activation times. N = 7-8 per group. * p < 0.05.

