
Figure 2. Spi-1 and Fli-1 directly activate miR-17-92 promoter in 745A#44 cells.
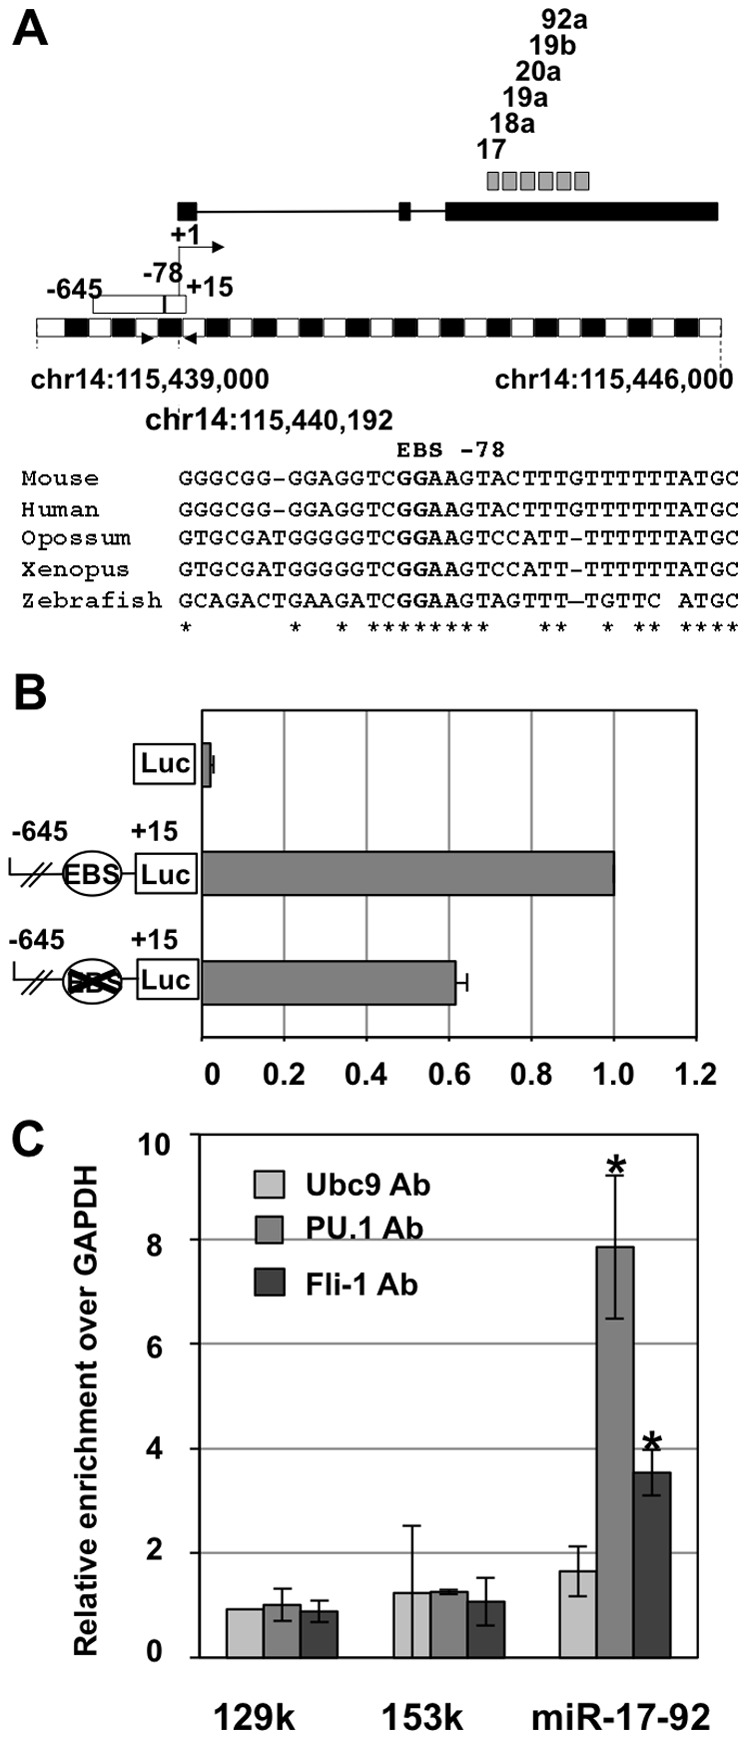
A: Schematic map of the mouse chromosome 14: 115,439,000–115,445,000 interval harboring the miR-17-92 cluster and flanking regions. Blacks and white boxes drawn upper the scale (250 bp units) correspond to the putative miR-17-92 primary transcript and to the −645/+15 promoter region used in B, respectively. Locations of the 6 different mature miRNAs sequences of the cluster are indicated by grey boxes. Primers used for ChIP analyses of Spi-1 and Fli-1 binding are indicated by black triangles. Sequences alignment illustrates −78 EBS conservation in Human, Mouse, Opossum, Xenopus and Zebrafish genomes. B: Reporter gene assays showing promoter activity of the −645/+15 region and its partial dependency on the conserved −78 EBS. 745#44 cells were co-tranfected with pCMV-βGal and pGL3, pGL3-EBS or pGL3-EBSmut luciferase reporter constructs as indicated. Luciferase activities were normalized to β-galactosidase determined 24 h after transfection and normalized relative luciferase activities were expressed with respect to the wild type construct (means and standard deviations from 3 different experiments). C: Chromatin immunoprecipitation (ChIP) assays showing Spi-1 and Fli-1 binding on the endogenous miR-17-92 promoter in 745A#44 cells. ChiPs assays were performed using Spi-1, Fli-1 or UBC9 (negative control) antibodies followed by q-PCR of mir-17-92 promoter and three negative control regions: GAPDH promoter, 129k and 153k. Results are expressed as relative enrichments of the sequence of interest over the GAPDH promoter sequence normalized to the enrichment determined on 129k region with control UBC9 antibody (means and standard deviations from 3 independent experiments). Asterisks indicate significant increase in the enrichment of miR-17-92 compared to 153k control sequences obtained with Fli-1 and PU.1 antiobodies (p<0.05).