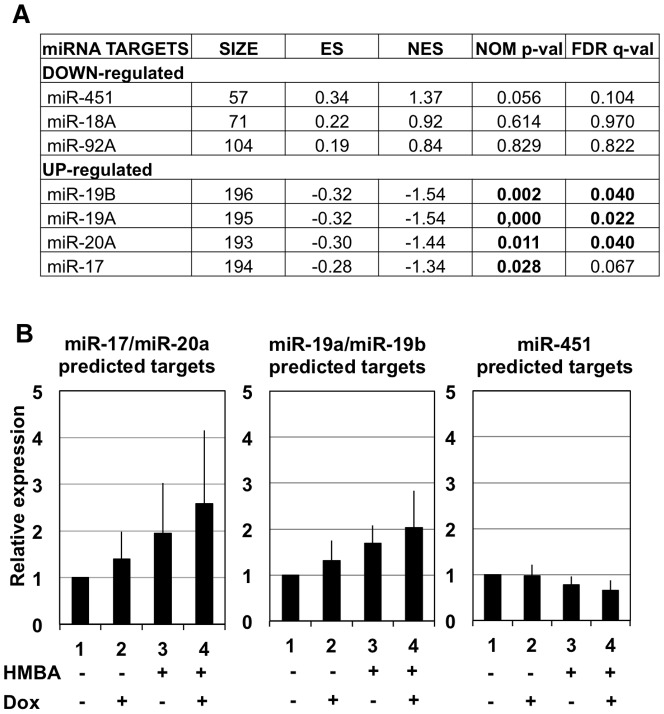
Figure 3. Up-regulation of miR-17-20a and 19a-19b predicted targets following Spi-1 and Fli-1 knockdown in 745A#44 cells.
A: GSEA (Gene Set Enrichment Analysis) of predicted miRNA targets in 745A#44 cells treated for two days with both HMBA and Dox versus untreated cells. Lists of targets predicted by three different algorithms (miRanda, miRDB and miRWalk) were compiled for each miRNAs from miRWalk web site. The size column displays the total number of predicted targets used for the analysis, ES and NES indicate the standard and normalized enrichment scores respectively and the last two columns display the normalized p-values and false discovery q-values of the enrichments. Significant enrichments are indicated in bold. B: Mean relative expression profiles of the leading edge subsets of common predicted targets for miR-17/20a, miR-19a/19b and miR-451 identified by GSEA in response to progressive decrease of miR-17-92 expression or progressive increase of miR-451 induced by indicated combinations of HMBA and Dox treatment in 745A#44 cells.

