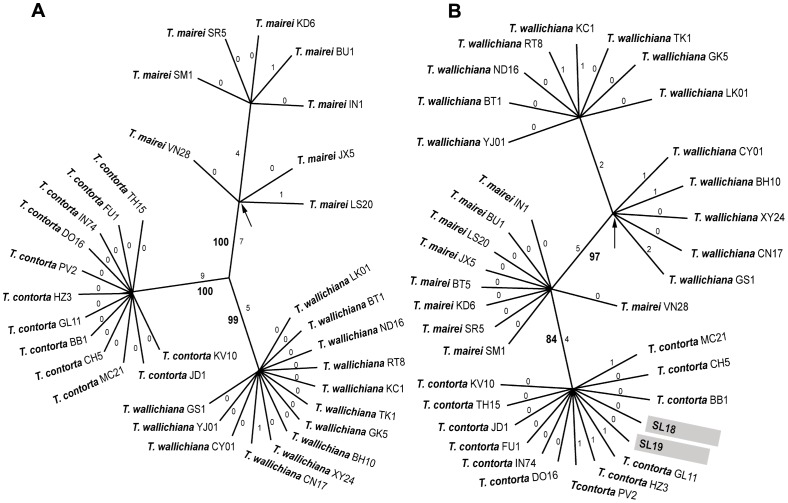
Figure 4. Maximum parsimony analysis.
Unrooted cladogram based on A. 33 ITS sequences (one of three most parsimonious trees shown) and B. 36 trnL-F sequences (one of five most parsimonious trees shown) of the three Taxus species of the Hindu Kush-Himalaya and adjacent regions. Small numbers along the branches indicate branch lengths and numbers in bold indicate bootstrap values. Arrows indicate branches that collapse in the strict consensus trees. Accessions highlighted in light grey in the trnL-F tree indicate a different position from the ITS tree.

