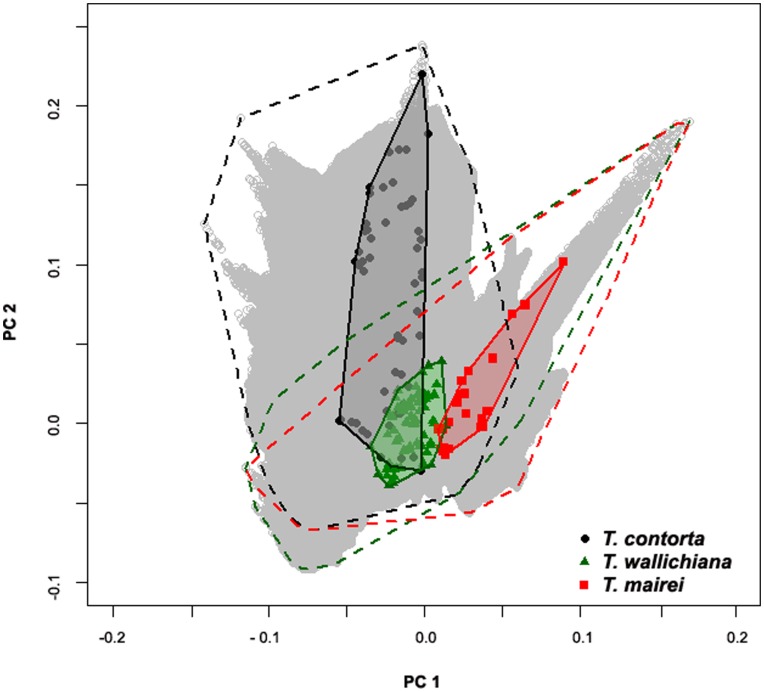
Figure 5. Principal component analysis (PCA) of bioclim variables and altitude.
PCA plot of the environmental conditions in the study area based on 15 variables and altitude used in the analyses following Broennimann et al. (2012). The PCA is centered and scaled to unit variance. The polygons delineated with black, green and red dashed lines show the environmental space within the T. contorta, T. wallichiana and T. mairei ranges respectively. The grey, red and green shaded polygons are minimum convex polygons surrounding the environmental space of the occurrence records for the species, i.e. the occupied environmental space.

