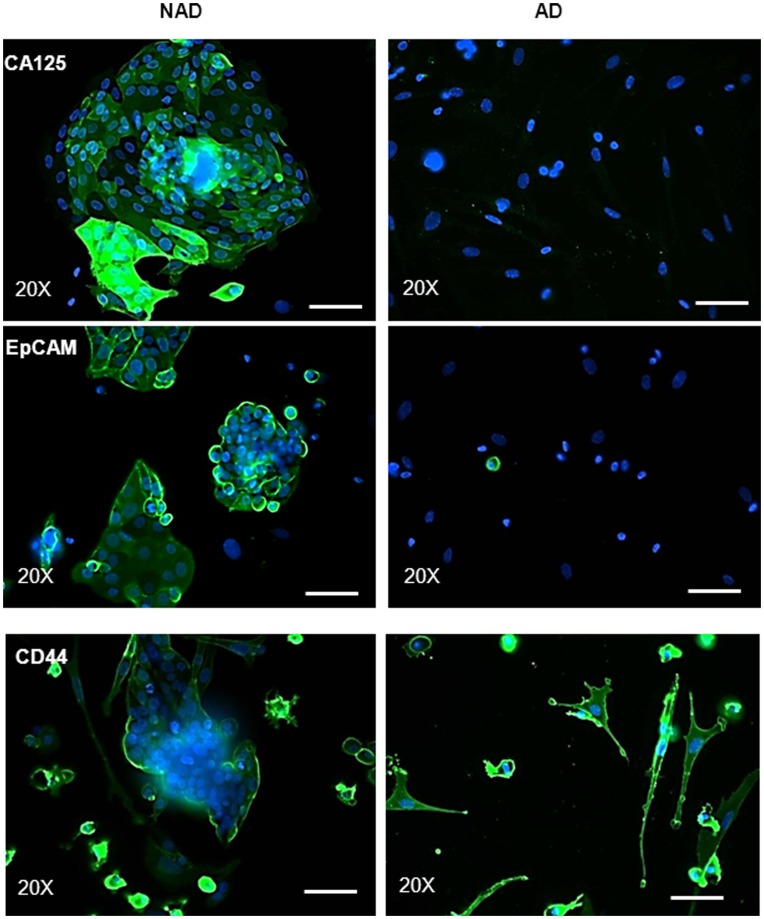
Figure 3. Expression and immunolocalization of CA125 and CSC markers by immunofluorescence.
Purified NAD and AD cells were evaluated by immunofluorescence using mouse monoclonal antibody (green) as described in the Methods and Materials. Cellular staining was visualized using the secondary Alexa 488 (green) fluorescent labeled antibody, and nuclei were detected by DAPI (blue) staining. Images are representative of three independent samples. Magnification was 200×; scale bar = 50 µm.

