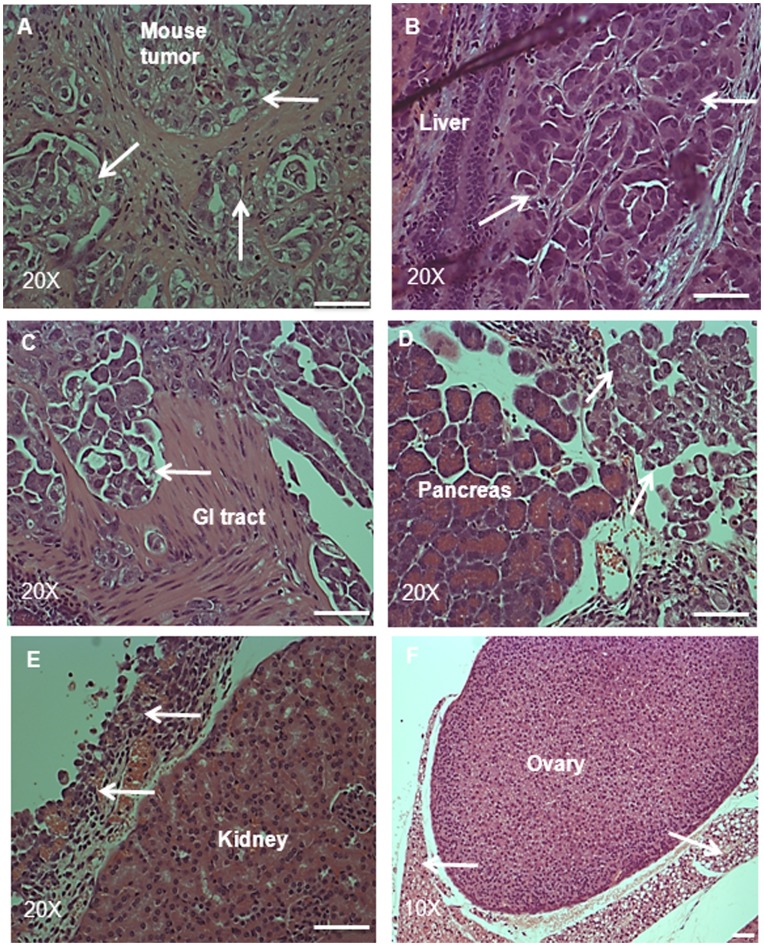
Figure 7. H and E staining of tumor and the associated infiltrated organs in a mouse.
Histological images of (A) tumor, (B) liver, (C) GI tract and (D) pancreas from a mouse injected i.p. with NAD cells (5×10⁶). Arrows in the tumor (A) indicate pockets of tumor cells surrounded by connective tissue. (B–D) arrows indicate tumor cells invading the respective organs. H and E staining of (E) kidney and (F) ovary from a mouse injected with NAD cells (5×10⁶). Arrows indicate tumor cells surrounding the organs without invasion. Magnification was 200× for all, except ovary which had magnification of 100×, scale bar = 50 µm.

