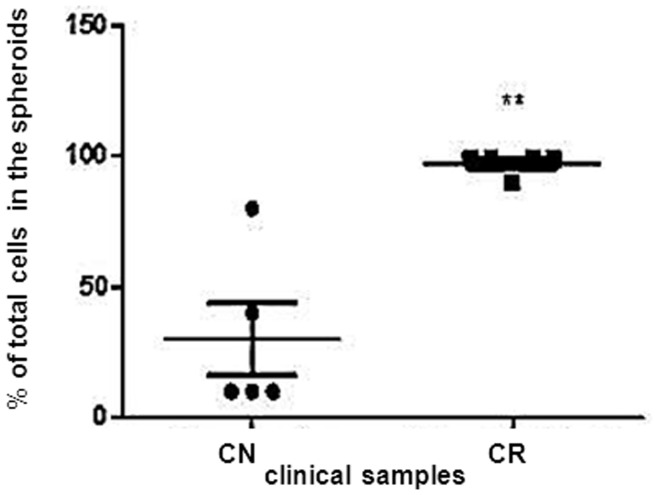
Figure 8. Cellular assessment of NAD and AD cells obtained from CN and CR patients.
Percentage distribution of total cells in the NAD and AD populations of ascites of CN (n = 5) and CR (n = 5) patients was determined by Trypan Blue Exclusion assay. Results are mean±SEM of five independent samples assessed in triplicate. Significantly different in CR versus CN samples, **(p<0.01).

