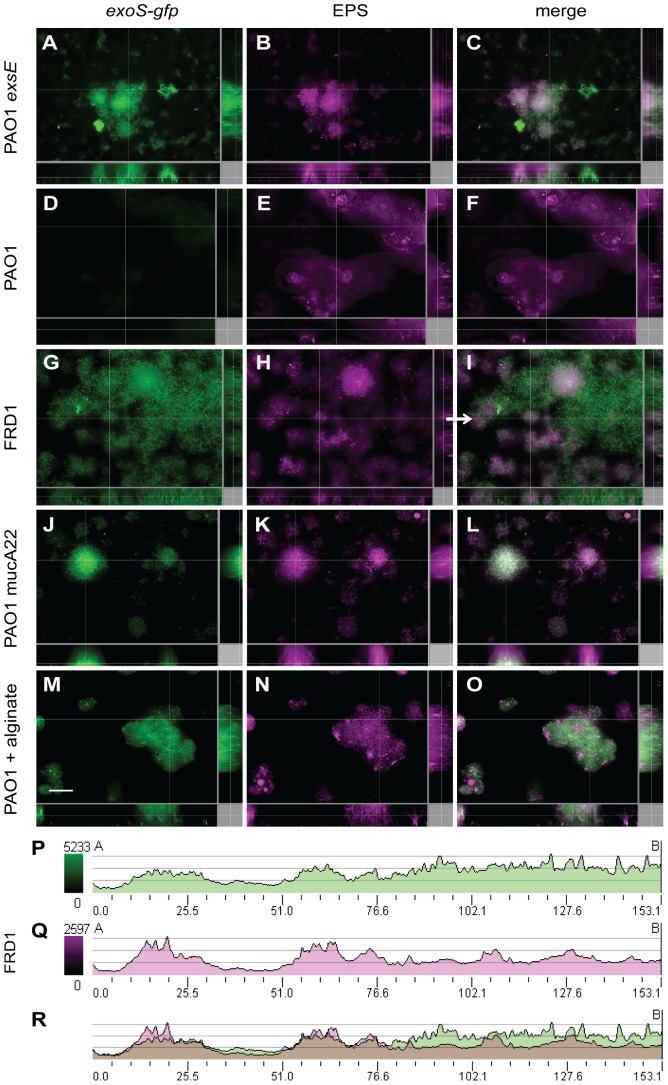
Figure 5. The T3SS expression is induced in flow chamber biofilms of mucoid, alginate producing P. aeruginosa strains.
Flow chamber-grown biofilms of (A–C) constitutive T3SS expressing strain PAO1 ΔexsE, (D–F) non-mucoid PAO1, (G–I) mucoid FRD1, (J–L) mucoid PAO1 mucA22 and (M–O) non-mucoid PAO1 with the exogenous addition of 10 mg/ml alginate, all encoding exoS-gfp were cultivated at 37°C for 2 days. Fluorescence microscopy shows the level of exoS-gfp expression in each strain (A, D, G, J) and the biofilm matrix counterstained with calcofluor for exopolysaccharides (B, E, H, K). The merged images are provided in the right column (C, F, I, L,O). In each case, representative images of x-y (large panel), x-z (bottom panel), and y-z (right panel) slices are displayed. Scale bar, 15 µm. The signal intensity was plotted for the green (exoS-gfp) (P) and purple (EPS) (Q) channels along the line indicated by the white arrow in the x-y plane displayed for FRD1 in panel I. The merged graph is provided (R), with the signal intensities overlapping for the green and purple channels to examine co-localization. Each experiment was performed at least three times and representative images are shown.

