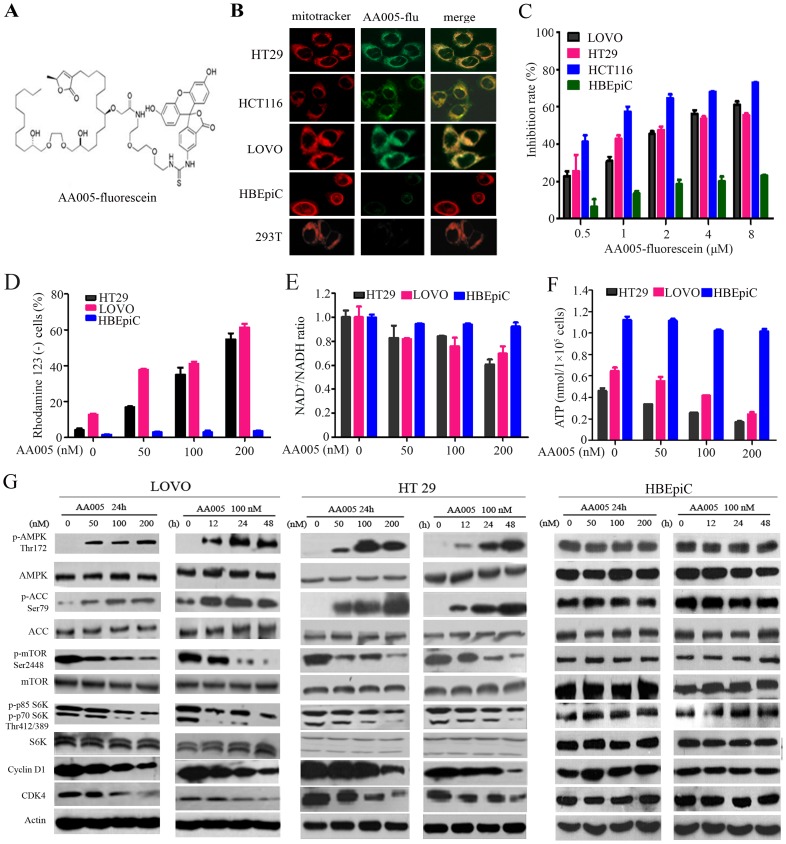
Figure 3. Effects of AA005 on ATP production and AMPK/mTOR signaling pathway.
(A) Chemical structure of AA005-fluorescein. (B) The intracellular localization of AA005. The cells were co-incubated with AA005-flu at 100 nM for 12 h, and analyzed by confocal microscopy using a mitotracker (red) to counter-stain mitochondria. (C) MTT assay of LOVO, HT29, HCT116 and HBEpiC cells upon AA005-flu at indicated concentrations for 48 h. (D) AA005 decreases the mitochondrial transmembrane potential of colon cancer cells revealed by increase in Rhodamine 123-negative cells. The cells were treated with AA005 at indicated concentration for 24 h and analyzed by Rhodamine 123 staining and flow cytometry. (E) The cells were treated with or without AA005 at indicated concentration for 24 h, NAD+/NADH ratio was measured using an AmpliteTM Colorimetric NAD/NADH Assay Kit. (F) The cells were treated with or without AA005 at indicated concentration for 24 h, and ATP content was measured using an ATP Bioluminescence Assay Kit. (G) The cells were treated with AA005 at indicated concentration and time points, lysed, and Western blot analysis was performed using indicated antibodies.

