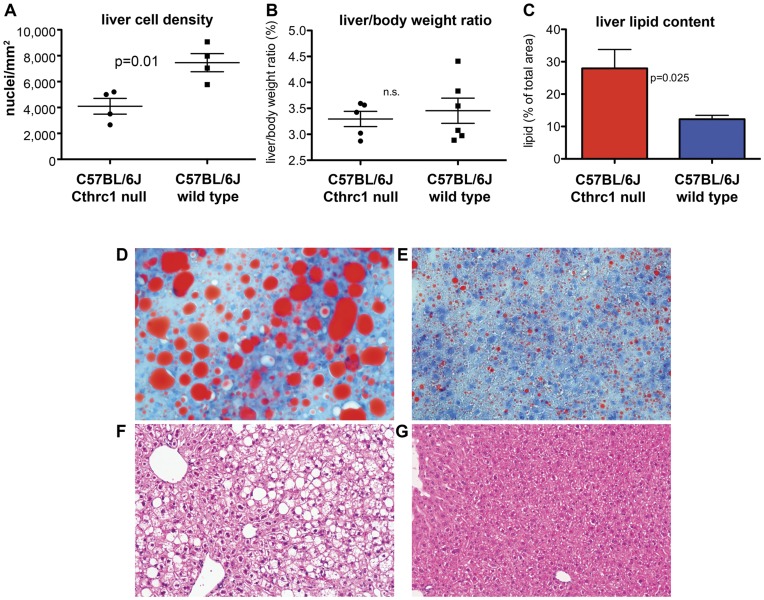
Figure 4. Fatty liver phenotype in C57BL/6J Cthrc1 null mice.
(A) Cell density in livers of wild type and Cthrc1 null mice (n = 4 per group). (B) Liver to body weight ratio was similar among groups. (C) Lipid content in liver was determined by image analysis on oil red O stained sectins of 7 month old mixed gender Cthrc1 null and wild type mice (n = 6 per group). (D) Oil red O stain of a liver section from a Cthrc1 null mouse shows macrovesicular and microvesicular steatosis and (E) only minor lipid accumulations in a wild type mouse. (F) Hematoxylin & eosin stain of a liver section from a Cthrc1 null mouse and (G) a wild type mouse.

