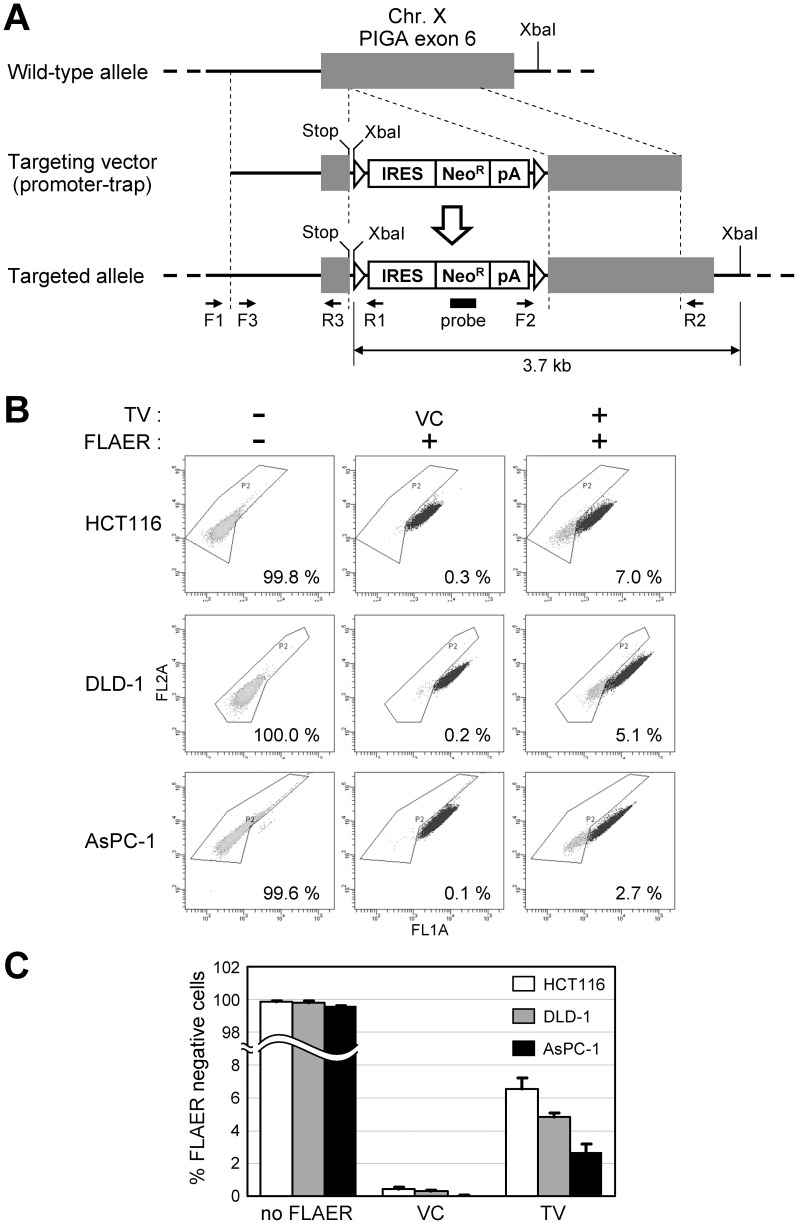
Figure 1. PIGA gene targeting in human somatic cell lines.
(A) A diagram of the promoter-trap PIGA targeting vector. Gray boxes indicate PIGA exon 6, while thick lines indicate PIGA intron 5 and intergenic genomic region. Thin dotted lines indicate homology between the endogenous gene locus and the targeting vector. F1 to F3 and R1 to R3 indicate PCR primers used in the experiment shown in Fig. 2A and B. A filled rectangle indicates the location of the probe used in Southern blot analysis shown in Fig. 2C. XbaI restriction enzyme sites are marked in the diagram. An arrow at the bottom shows the distance between two XbaI sites at the targeted PIGA gene locus. Triangles: loxP; Stop: stop codon (TAA); IRES: internal ribosomal entry site; NeoR: neomycin resistance gene; pA: polyadenylation site. (B and C) Human somatic cell lines were infected with the promoter-trap PIGA targeting vector or a vector control (VC), and processed for FLAER staining and then flow cytometric analyses. Shown are the representative dot plots (B) and a graphic representation of the entire results (mean ± s.e.m.; n = 3) (C). In (B), the FLAER-negative ratio for each experiment is noted in the dot plot. TV: promoter-trap PIGA targeting vector.

