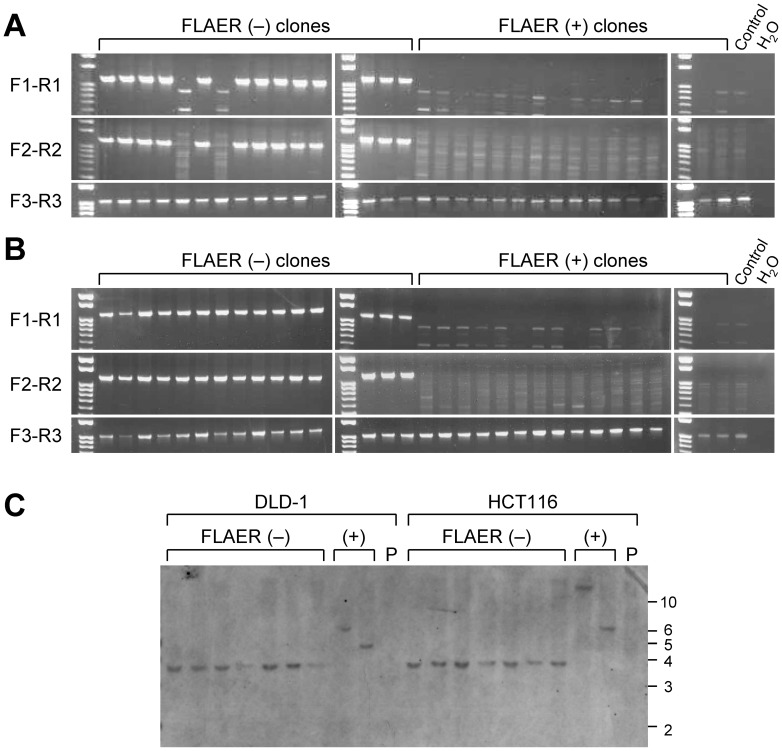
Figure 2. Confirmatory assays examining the PIGA gene locus in FLAER-negative and -positive cell clones.
(A and B) Representative results of PCR examining FLAER-negative and -positive single cell clones derived from HCT116 (A) and DLD-1 (B) infected with the promoter-trap PIGA targeting vector. PCR was conducted with primer pairs F1-R1, F2-R2 and F3-R3 that yielded PCR products of 1,140 bp, 1,184 bp, and 1,031 bp in size, respectively. For the location of primers, see Fig. 1A. Control: parental cell lines. (C) Southern blot analysis of FLAER-negative and -positive single cell clones. Genomic DNA was digested with XbaI, separated on a gel, and hybridized with a probe shown in Fig. 1A. The positions of the DNA size standards are shown to the right in kilobase. P: parental cell lines.

