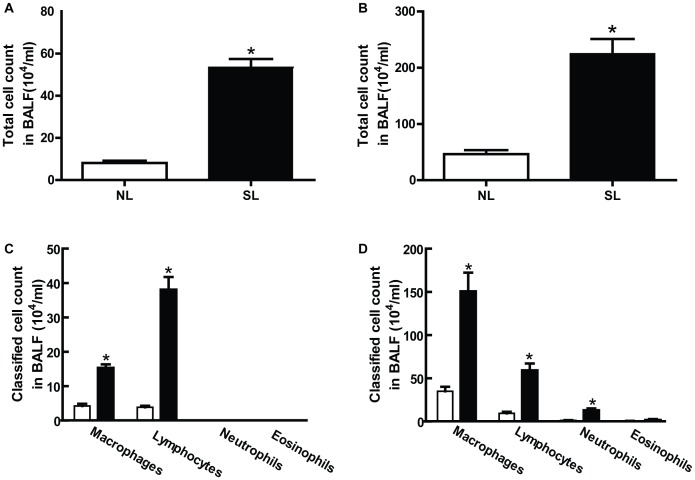
Figure 3. The effect of neonatal overfeeding on the total and classified cells number in BALF on P21 and P150.
The total cells were counted with cell counter on P21 (A) and P150 (B); the classified cells were performed with Wright–Giemsa on P21 (C) and P150 (D). Data were expressed as mean± SEM, and the significant difference between two groups was analyzed by Student t-tests, *P<0.05.

