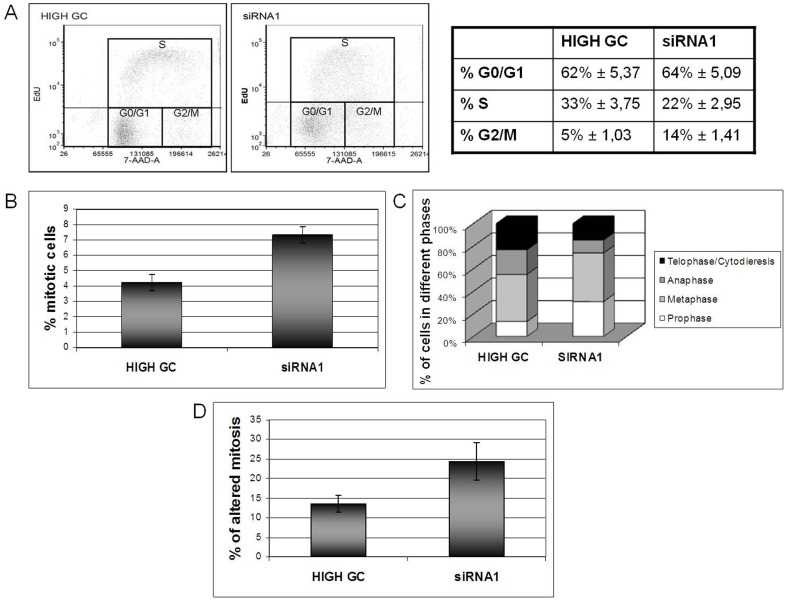
Figure 4. MYBBP1A-depleted HeLa cells are blocked in S/G2.
(A) Flow cytometry and cell cycle analysis of HeLa cells after EdU incorporation using anti-EdU antibodies and 7-AAD. Flow cytometry histograms show cell cycle distribution and quantitation of HeLa cells transfected with High-GC or siRNA1 oligonucleotides, at 72 h post-transfection. (B) Quantitation of mitotic figures in control (High GC) and siRNA1 transfected HeLa cells performed with confocal microscope. (C) Quantitation of cells in the various phases of cell cycle in control (High GC) and siRNA1 transfected HeLa cells by confocal microscope. (D) Measurement of the percentage of anomalous mitotic figures in control (High GC) and siRNA1 treated HeLa cells by confocal microscope.

