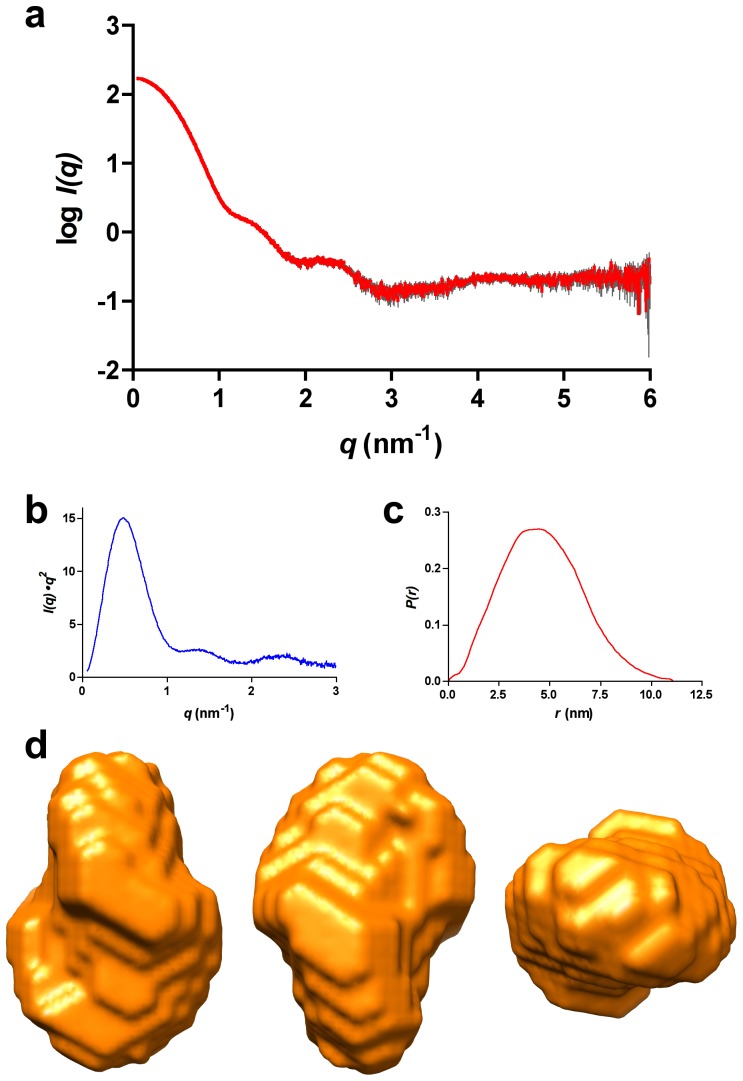
Figure 4. SAXS analysis of ATV.
 .
a) SAXS intensity as a function of the momentum transfer. This profile corresponds to the measurements taken at 4.7 mg/ml protein cocentration and pH 8.5. Average values are in red and the standard error in grey. b) The Kratky plot (see text for details) corresponds to a folded protein. c) Pair-distance distribution, P(r), function of the data shown in panel a). d) Three orthogonal views of the ab initio envelope calculated imposing orthorhombic symmetry.

