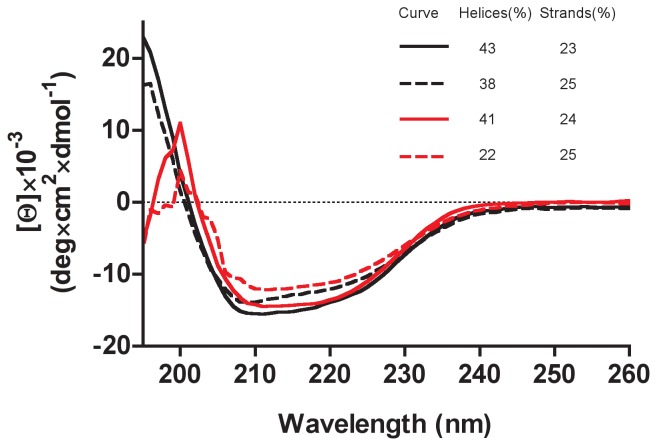
Figure 5. Circular dichroism spectra of ATV.
 . Mean residue ellipticity spectra recorded at pH 7.2 (black lines) and pH 0 (red lines), either at 20°C (full lines) or at 80°C (dashed lines). The content in helices and strands, as determined by deconvolution of the spectra, is shown (see text for details).

