
Figure 3. Effect of HTRA1 on the proliferation of RF/6A cells and HUVECs.
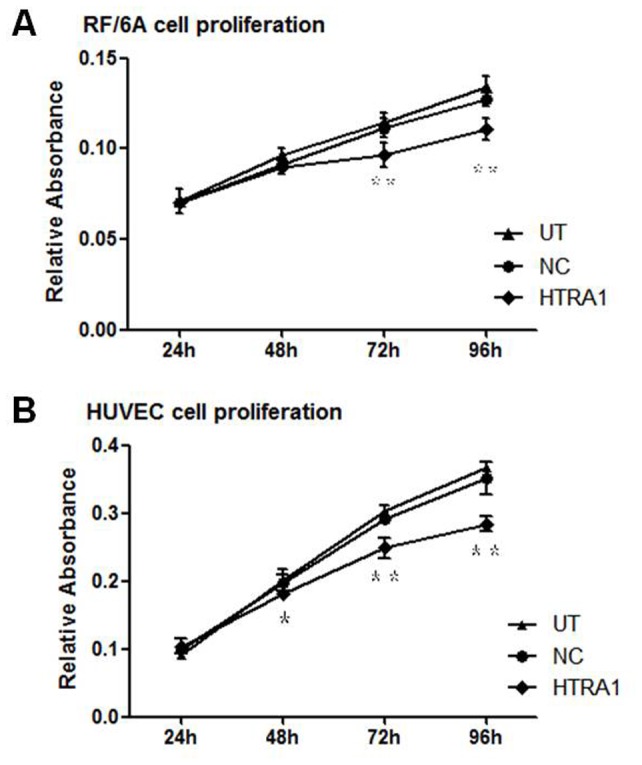
Proliferation of RF/6A cells (A) and HUVECs (B) was measured with an MTT assay at 24, 48, 72 and 96 h. The values are listed as the means±SD of at least three independent experiments. Compared with the control groups, RF/6A cell proliferation was reduced by 7% at 48 h and this reduction peaked at 17% on the fourth day (**p<0.01); HUVEC proliferation was reduced by 10% (*P<0.05) at 48 h, and this reduction peaked at 23% (**P<0.01).