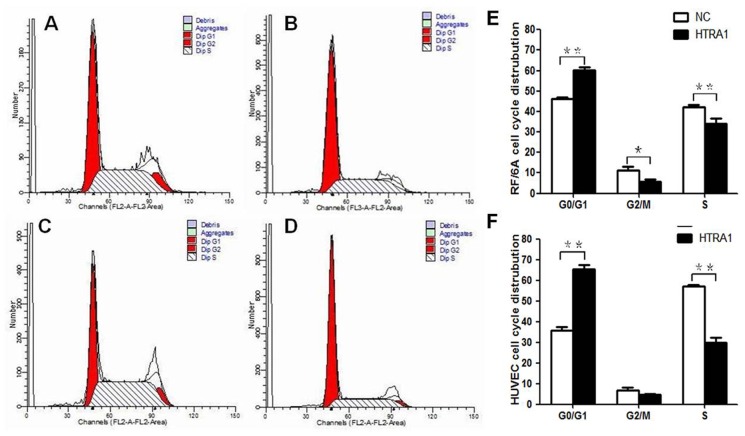
Figure 4. Effect of HTRA1 on the cell cycles of RF/6A cells and HUVECs.
Flow cytometric analysis demonstrated that the fraction of G1-phase cells increased and the proportion of S-phase cells decreased in the RF/6A cells (A and B) and HUVECs (C and D) after increased expression of HTRA1. The proportions of G0/G1, G2, and S phase cells decreased in HTRA1-transfected RF/6A cells compared to control RF/6A cells transduced with the lentiviral vector (E, *p<0.05, **p<0.01). The proportions of G0/G1-and S-phase cells were decreased in HTRA1-transfected HUVECs compared with the control HUVECs transduced with the lentiviral vector (F, **p<0.01).

