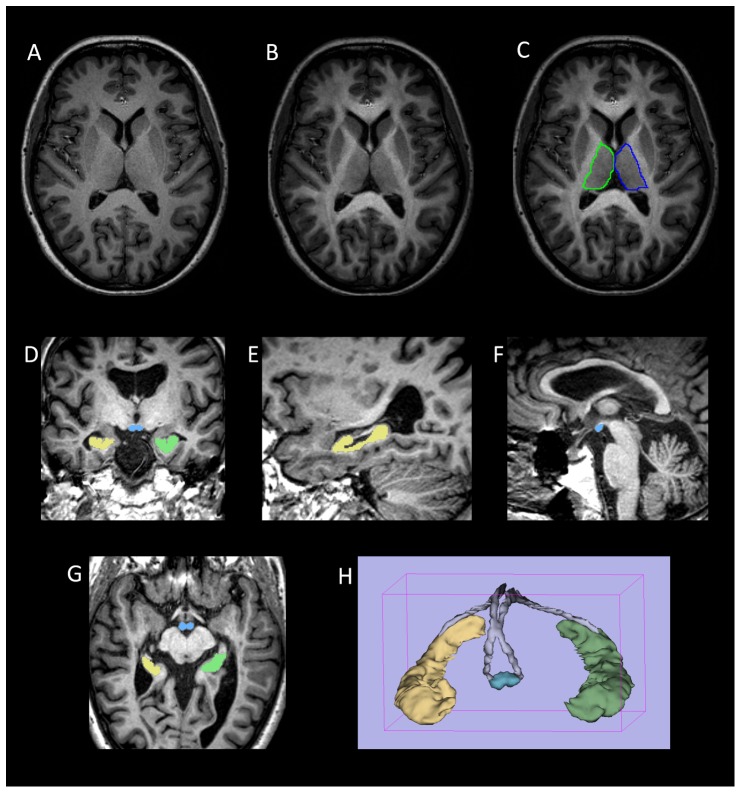
Figure 1. Volumetric segmentation of brain images.
(a–c) Thalamic segmentation. Axial MPRAGE image from a control subject (a) before and (b) after the addition of FA weighting from the co-registered FA image. Note the increase in clarity of the lateral border of the thalamus that facilitates (c) manual segmentation of the thalamus. (d–g) axial, coronal and sagittal images from a participant with MS demonstrating ROIs drawn for the mammillary bodies (blue) and right (yellow) and left (green) hippocampi. (h) Surface rendered representation of the segmented hippocampi and mammillary bodies from a participant with MS. The manually defined fornix ROI used to derive fornix FA is also shown (grey).

