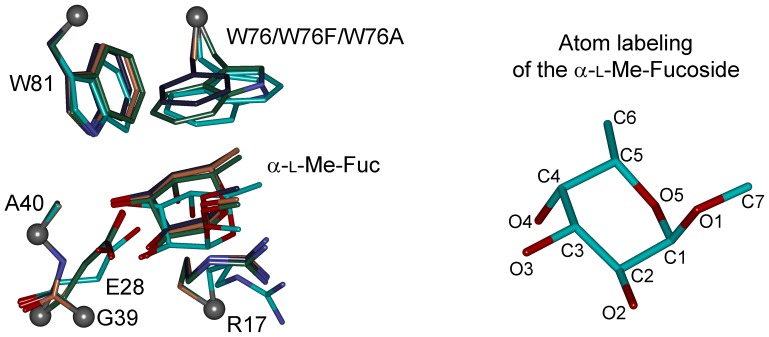
Figure 2. Superimposition of the modeled active site structures.
The X-ray structure and the structures of the mutated models' carbons are colored in cyan, optimized BS_W76 model carbons are colored in green, optimized BS_W76F model carbons are colored in violet and optimized BS_W76A model carbons are colored in light brown. Balls represent restrained alpha carbons.

