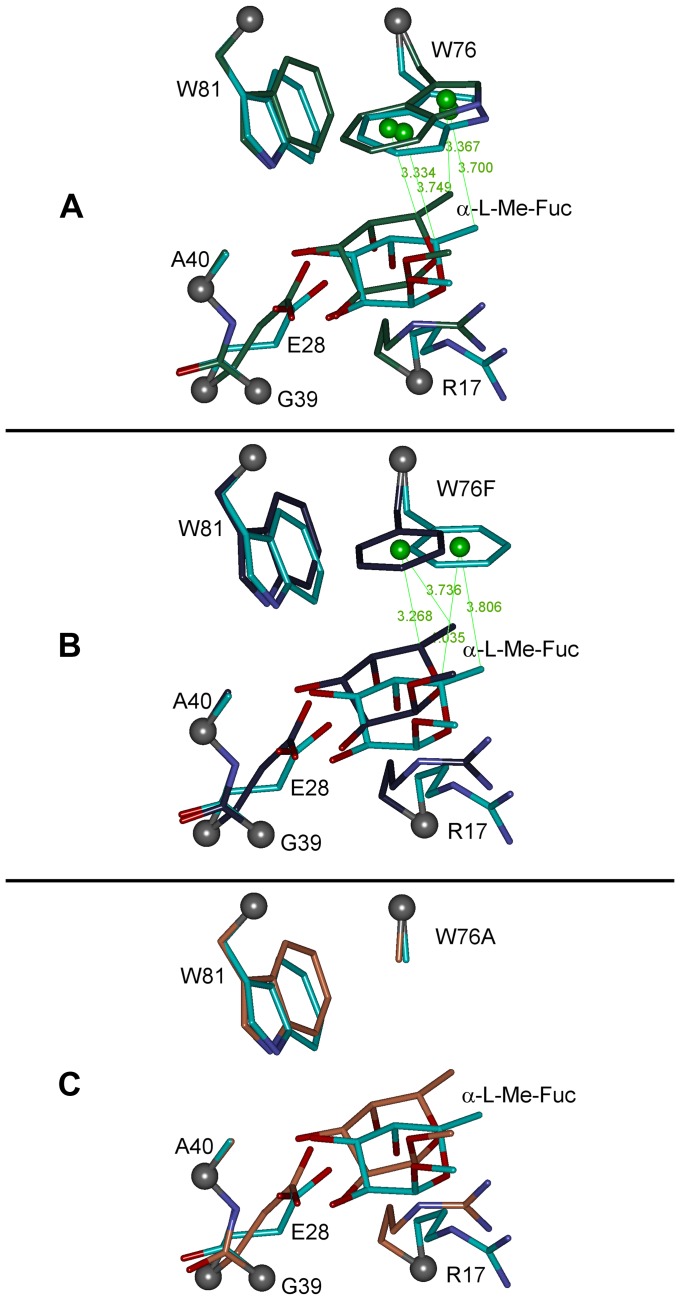
Figure 4. Overlay of the RSL binding site models before and after geometry optimization.
Overlay of the wild type binding site model (BS_W76) before (cyan) and after (green) optimization (A); RSL W76F mutant binding site model (BS_W76F) before (cyan) and after (violet) optimization (B); RSL W76A mutant binding site model (BS_W76A) before (cyan) and after (light brown) optimization (C). Selected distances from the geometrical centers of tryptophan's indol part and the phenyl part of phenylalanine geometrical center are shown.

