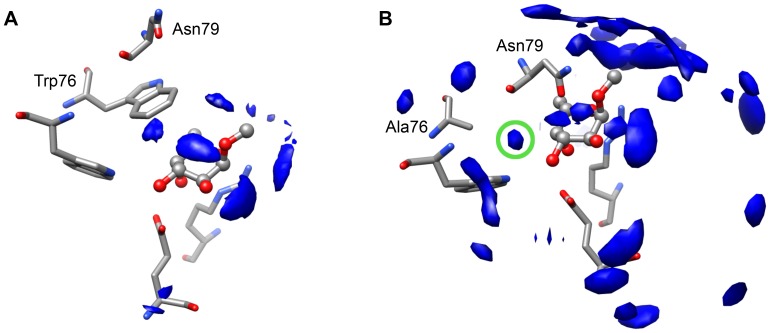
Figure 5. Comparison of the observed water densities from the MD simulation of the wild type RSL and W76A RSL mutant.
The water densities in the 34 ns long molecular dynamic simulations of the wild type RSL (A) and W76A RSL mutant (B) are shown. Detailed analysis of the trajectories show increased water density around the α-L-Me-fucoside moiety in the W76A mutant in position occupied by Trp76 side chain in the wild type lectin complex simulation. This increased water density is highlighted by green circle. The α-L-Me-fucoside is shown in ball and stick representation.

