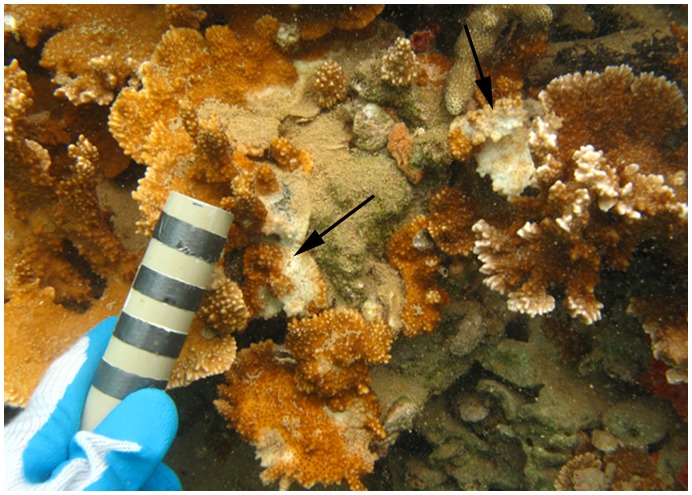
Figure 1. Subacute tissue loss pattern of cMWS.
M. capitata colony from the field with disease signs of chronic Montipora white syndrome. The colony also shows algal overgrowth of a majority of the skeleton exposed by the infection. Arrows indicate progressing disease fronts. Bands on the scalar bar represent 1 cm increments.

