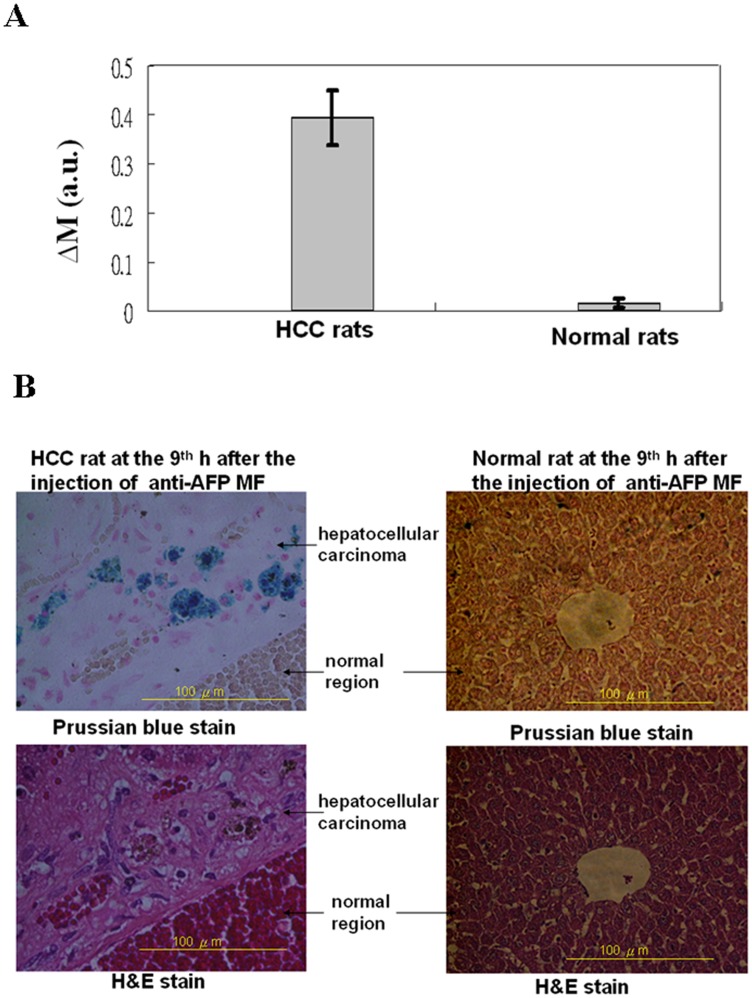
Figure 3. In vitro and biopsy tests.
(A) Analysis of the ΔM of SSB for the differences between the magnetization nine hours after the time of injection; and (B) optical images of the H&E staining and Prussian blue staining for the liver tissue nine hours after the time of injection. MF represents magnetic fluid.

