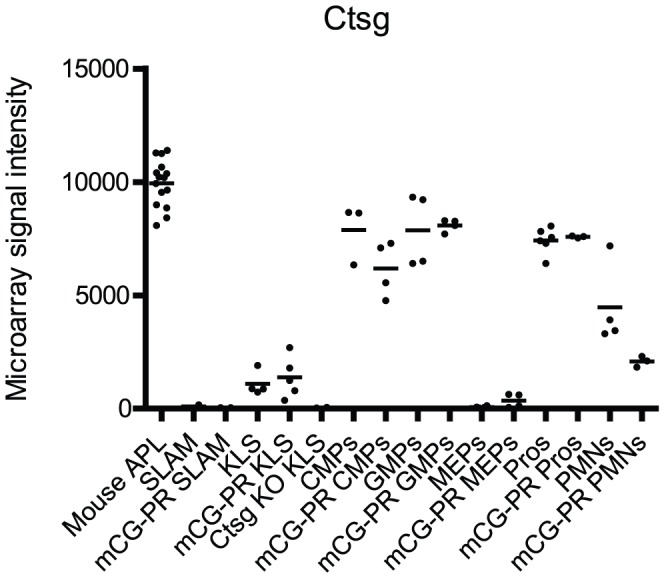
Figure 1. Expression of Ctsg in flow-sorted bone marrow cells and mouse leukemia samples.

Expression profile in indicated WT and Ctsg-PML-RARA (labeled mCG-PR) flow-sorted bone marrow cells and 15 Ctsg-PML-RARA leukemia samples (labeled Mouse APL) using Nugen amplified mRNA and Affymetrix Mouse Exon 1.0ST arrays. We plotted Ctsg expression for probeset 5542324. Note the absence of Ctsg mRNA in Ctsg deficient cells (labeled Ctsg KO). There were no statistically significant differences in Ctsg expression between the same cell populations, when comparing WT and Ctsg-PML-RARA samples (using two-tailed t test, p-value cutoff 0.05). Comparing the levels of Ctsg expression between the Ctsg-PML-RARA samples using a two-tailed t test, the p-value for SLAM vs. KLS = 0.11, KLS vs. CMPs = 0.00026, CMPs vs. GMPs = 0.022, GMPs vs. MEPs 2.4×10⁻⁸, MEPs vs. Pros 2.6×10⁻⁷, GMPs vs. Pros = 0.027, Pros vs. PMNs = 2.4×10⁻⁶.
