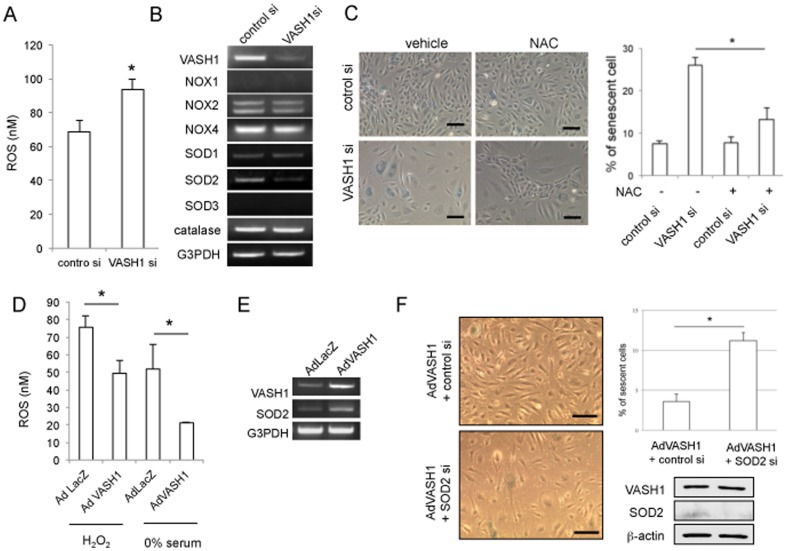
Figure 5. VASH1 controls SOD2 level and decreases ROS level in HUVECs.
(A) HUVECs were transfected with VASH1 siRNA or control siRNA. After a 24-hour incubation, cellular ROS was determined as described in Materials and Methods (*P<0.01, N = 3). (B) HUVECs were transfected with VASH1 siRNA or control siRNA. Twenty-four hours later, RT-PCR for the indicated genes was performed. (C) HUVECs were transfected with VASH1 siRNA or control siRNA in the presence or absence of 50 µmol/L NAC. After a 12-hour incubation, the culture medium was replaced with growth medium containing vehicle or 50 µmol/L NAC. After a 6-day culture, SA β-gal staining was performed. Scale bars are 250 µm. SA β-gal-positive HUVECs were quantified, and the % of senescent cells was calculated (*P<0.01, N = 3). (D) HUVECs were infected with AdVASH1 or AdLacZ. After a 24-hour incubation, the cells were exposed to 100 µmol/L H2O2 for 1 hour or to 0% FCS/αMEM for 6 hours. Thereafter, the cellular ROS level was determined (*P<0.01, N = 3). (E) HUVECs were infected with AdVASH1 or AdLacZ. After a 24-hour incubation, RT-PCR for VASH1 and SOD2 was performed. (F) HUVECs were infected with AdVASH1 or AdLacZ. After a 24-hour incubation, HUVECs were then transfected with SOD2 siRNA or control siRNA. After a subsequent 24-hour incubation, the cells were exposed to 100 µ mol/L H2O2 for 1 hour followed by a 48-hour incubation in growth medium. Scale bars are 250 µm. SA β-gal staining and Western blotting for VASH1 and SOD2 were then performed. SA β-gal-positive HUVECs were quantified, and the % of senescent cells was calculated (*P<0.01, N = 3). All the studies were repeated at least 3 times to confirm the reproducibility.

