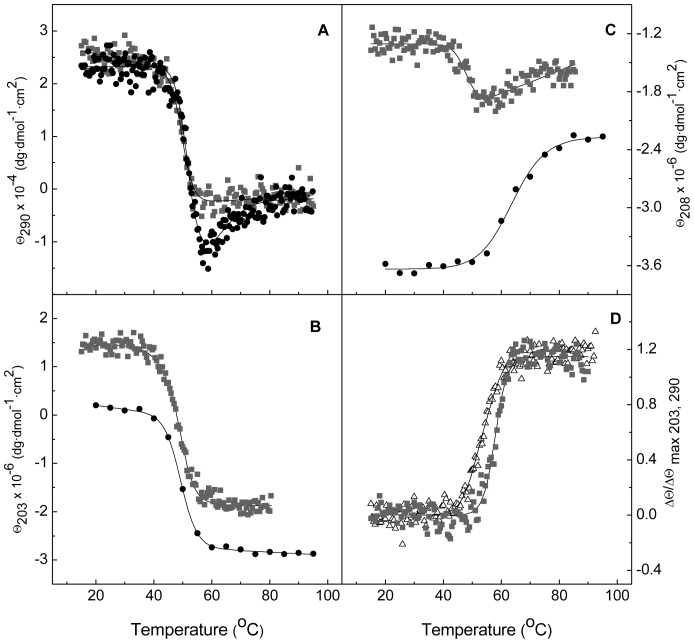
Figure 4. Comparison of the full-length protein and the CM thermal transitions.
(A), (B) and (C) compare the CD denaturation profiles of Cpl-7 (black circles) and the CM alone (greysquares) monitored at 290 nm, 203 nm and 208 nm, respectively, in 20 mM Pi buffer pH 7.0 (scan rate of 40°C h−1). For comparison, ellipticities per mole of molecule were used instead of the average molar ellipticities per residue. (D) shows the differences in the relative ellipticity vs temperature profiles at 290 nm (squares) and 203 nm (triangles) for the CM denaturation at pH 6.0. The continuous traces are the curves calculated as indicated in the text with the best fitting parameters (Tables 1 and 2).

