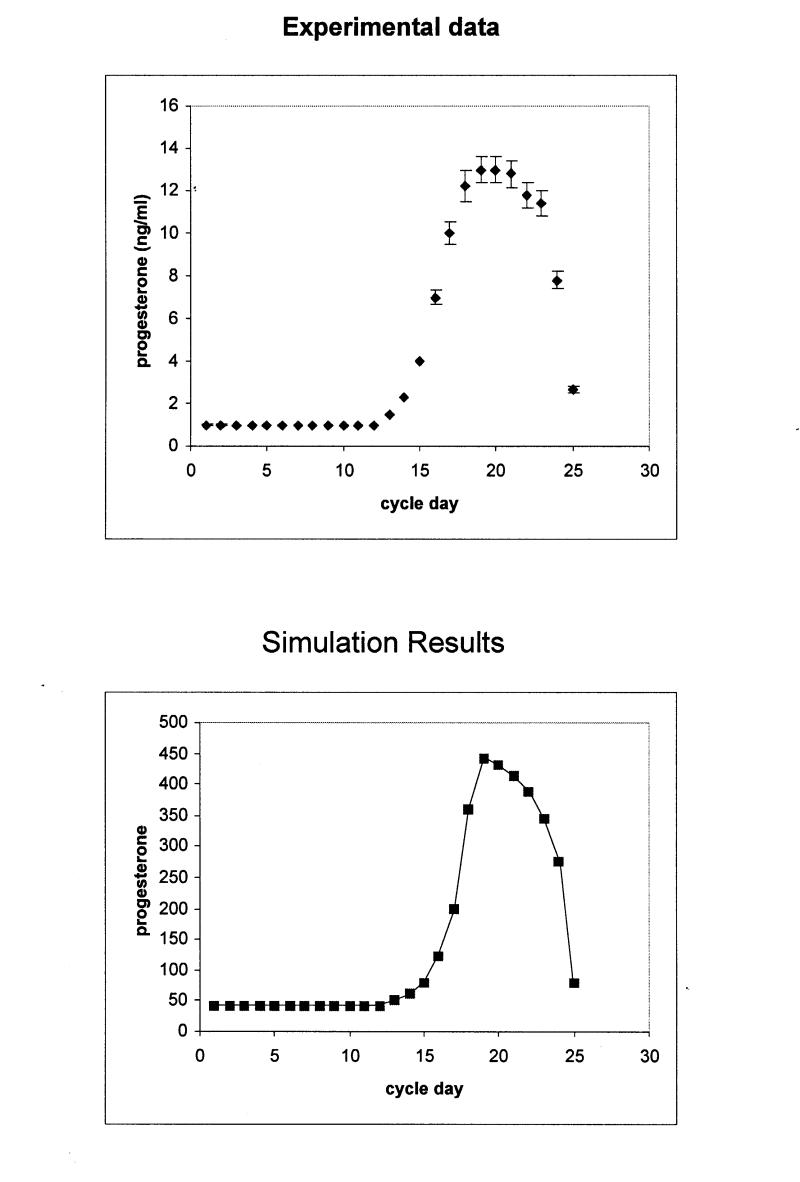
Figure 3b .
Upper panel: Progesterone production during the normal menstrual cycle derived by hormone measurements. Bottom panel: Simulation of progesterone production during the normal menstrual cycle using the stochastic activity model. The scale differs from that of the experimental data, because values are given in tokens. The rms for the calculation is 1.8 pg/ml.

