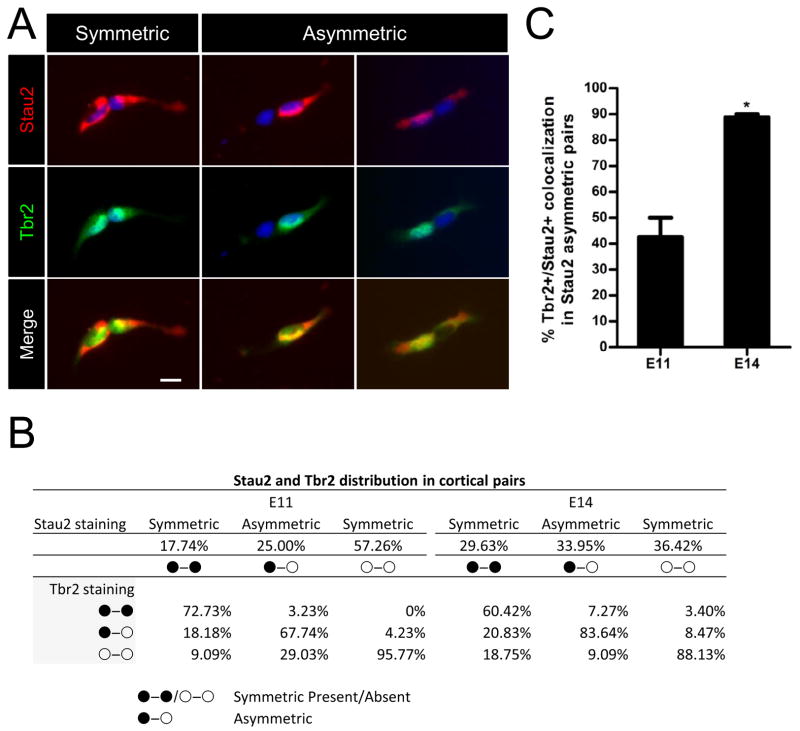
Figure 3. Stau2 Preferentially Distributes into the IPC at Midgestation.
A) Stau2 (red) shows both symmetric and asymmetric distribution in E11 and E14 cultured progenitor daughter cell pairs. Single cortical progenitor cells were plated at clonal density, mapped to record their initial position and fixed at 20–24 hours. Staining for Stau2 (strong red perinuclear/nuclear staining identified as Stau2+) and IPC marker Tbr2 (green) reveals Stau2 preferentially segregates into Tbr2+ cells (green, nuclear). Scale bar 10 μm. B) Summary of Stau2 and Tbr2 distribution patterns. C) Percentage of Tbr2 colocalization with the Stau2+ daughter in cell pairs asymmetric for Stau2. At E11, of the 67.7% of cells showing asymmetric localization of Stau2 and Tbr2 (in B), 42.5% have Stau2 and Tbr2 in the same daughter cell. This is increased at E14: of the 83.6% of cells showing asymmetric localization of Stau2 and Tbr2 (in B), 88.8% have Stau2 and Tbr2 in the same daughter cell (mean ± SEM Student’s t-test; *p<0.5). n=124 pairs at E11 and n=164 pairs at E14. Scale bar is 10 μm

