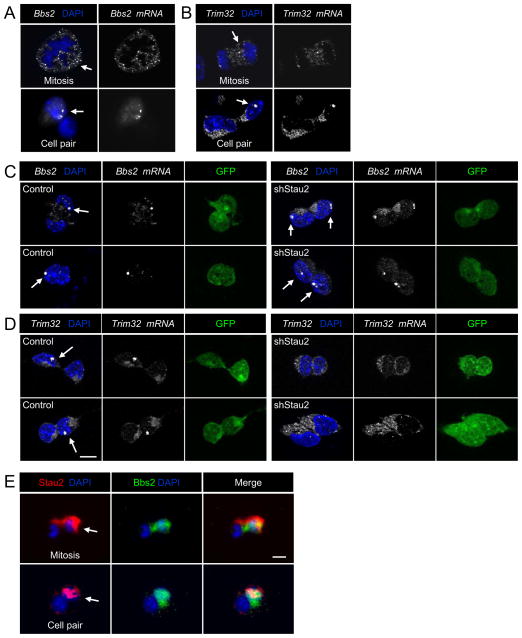
Figure 7. Fluorescent In Situ Hybridization Reveals Asymmetric Localization of Stau2 mRNA Targets in Cultured Neural Progenitors.
Bright concentrated dots of mRNA staining are often observed for both Bbs2 and Trim32 mRNAs (arrows). A) Localization of Bbs2 mRNA in a cell entering metaphase (top, arrow). Asymmetric expression of Bbs2 in daughter cell pairs (bottom, arrow). B) Asymmetric localization of Trim32 mRNA in a cell in anaphase/telophase (top, arrow). Asymmetric expression of Trim32 in daughter cell pairs (bottom, arrow). C,D) Asymmetric distribution of Bbs2 and Trim32 mRNAs in daughter cell pairs is altered after Stau2 knockdown. Bright dots for Bbs2 are asymmetric in control and symmetric in shRNA Stau2 treated panels (arrows). Bright dots for Trim32 (arrows) are asymmetric in control and not visible in shRNA Stau2 treated panels. E) Bbs2 protein (green) is asymmetrically localized in dividing cortical progenitors and in daughter cell pairs, and co-localizes with Stau2 protein (red). Scale bar is 10 μm.

