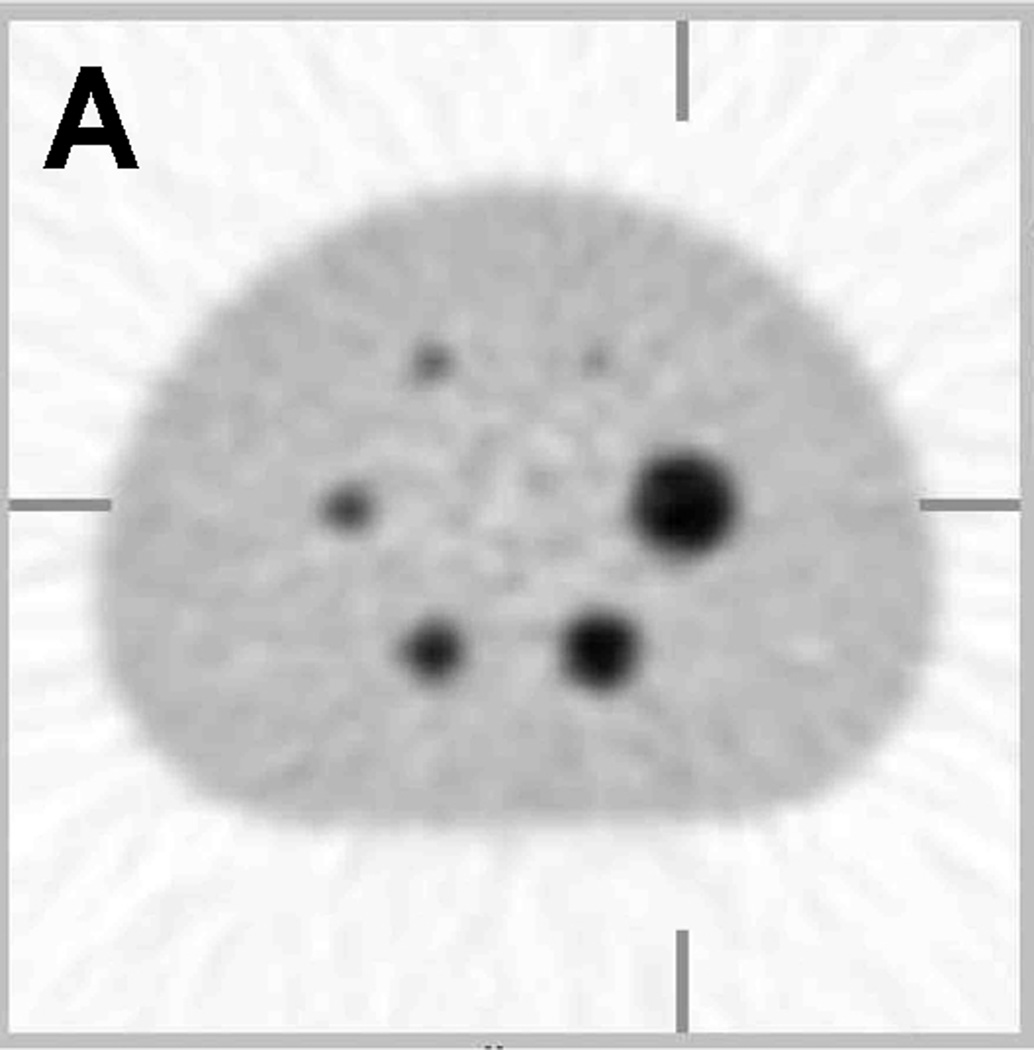
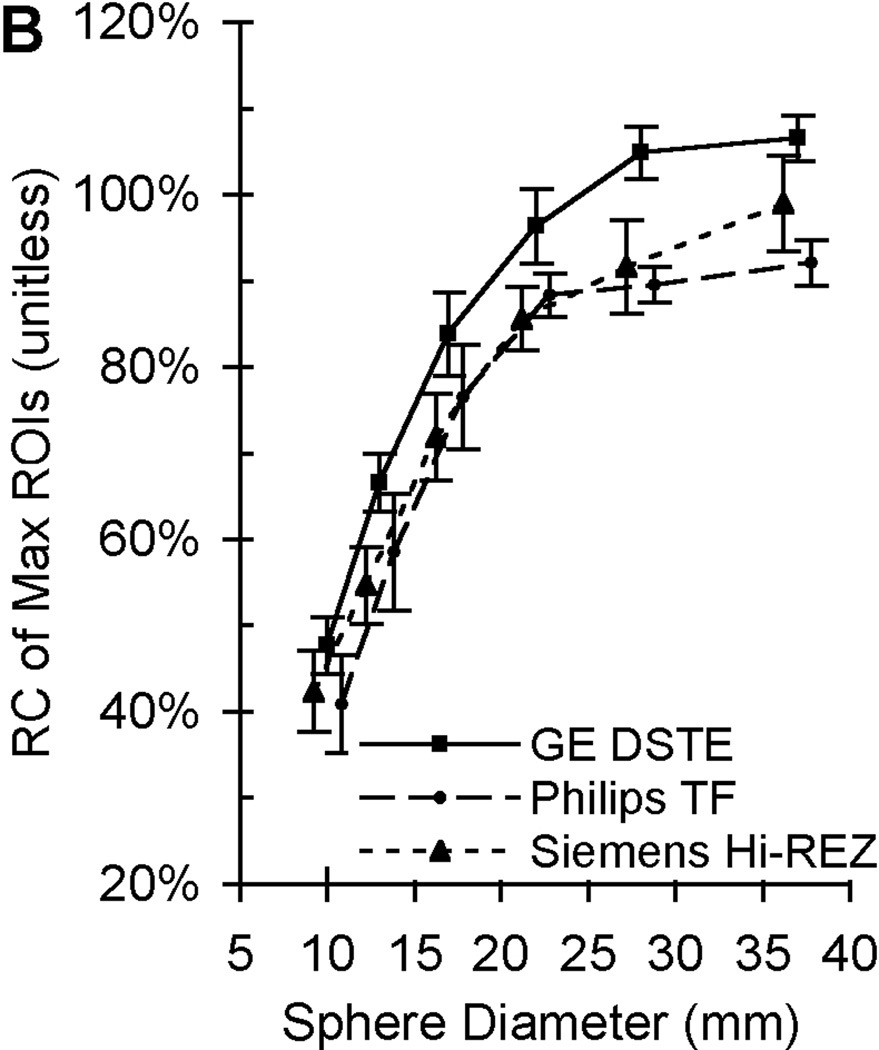
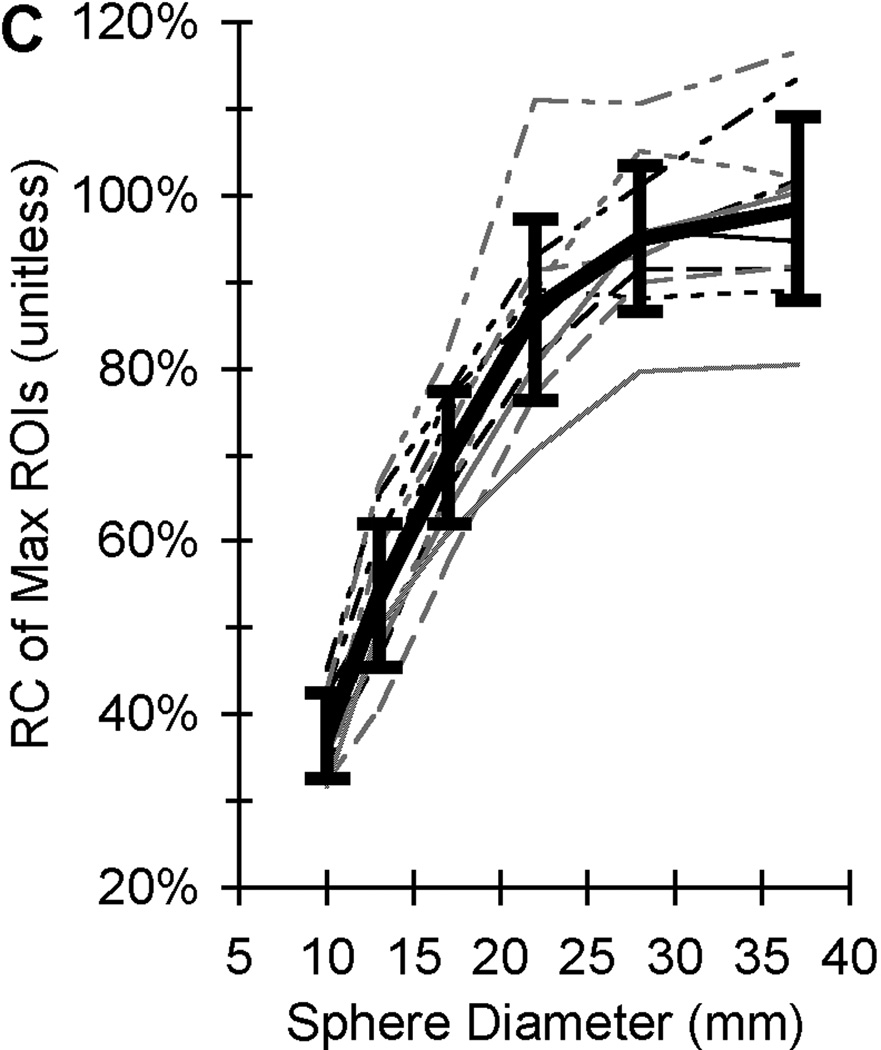
Figure 1.
Sample PET image and recovery coefficient measurements of the same phantom filled with long half-life 68Ge epoxy. (A) A sample PET image of the modified NEMA NU-2 Image Quality (IQ) phantom with hot sphere diameters range from 10 to 37 mm. (B) Average recovery coefficients (RC) of maximum ROIs (measured / true) based on 20 repeat scans by 3 scanners at 3 sites with each scanner made by a different manufacturer (adapted from Doot et al. [22]). (C) Recovery coefficients of maximum ROIs from single scans from 11 different PET scanners with the average value represented by a thick black line (adapted from Doot et al. [38]. Error bars represent the standard deviation of maximum ROI measurements from 20 scans by a single scanner in (B) and one scan by eleven scanners in (C).


