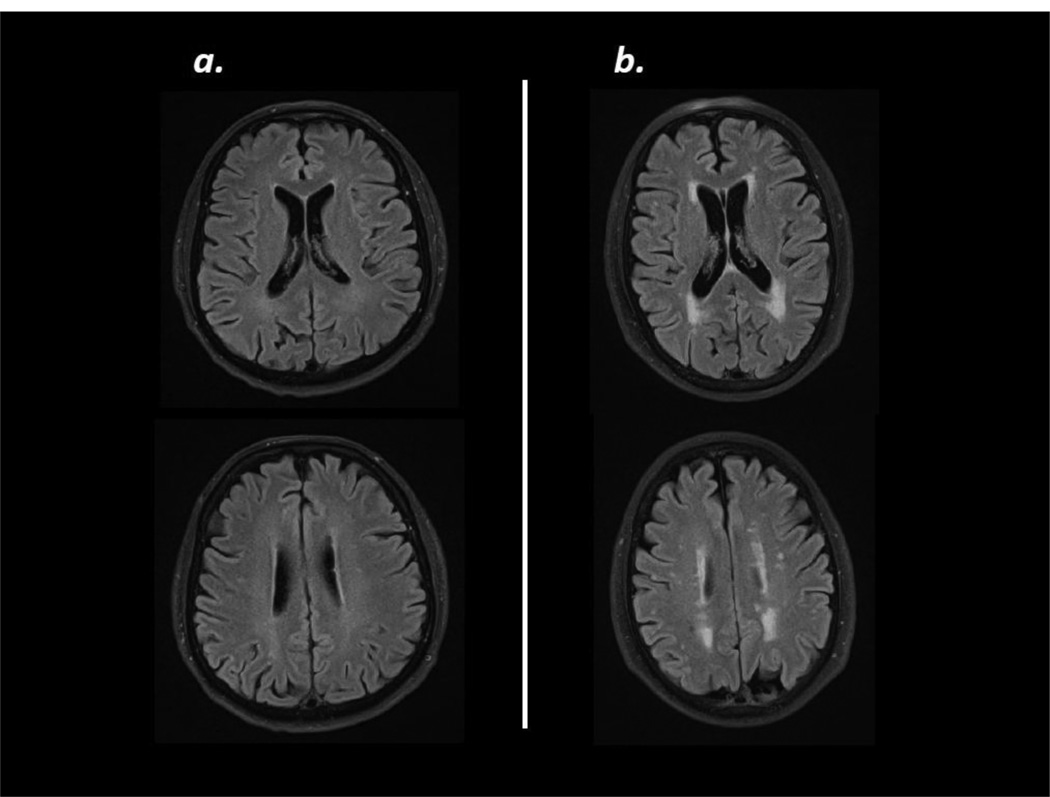
Figure 2.
Example MRIs (5mm axial FLAIR) showing the typical range of white matter disease in this study. The scan on the left (a) shows minimal white matter disease corresponding to a combined Fazekas score of 1 and the scan on the right (b) shows a moderate amount of white matter disease corresponding to a combined score of 3.

